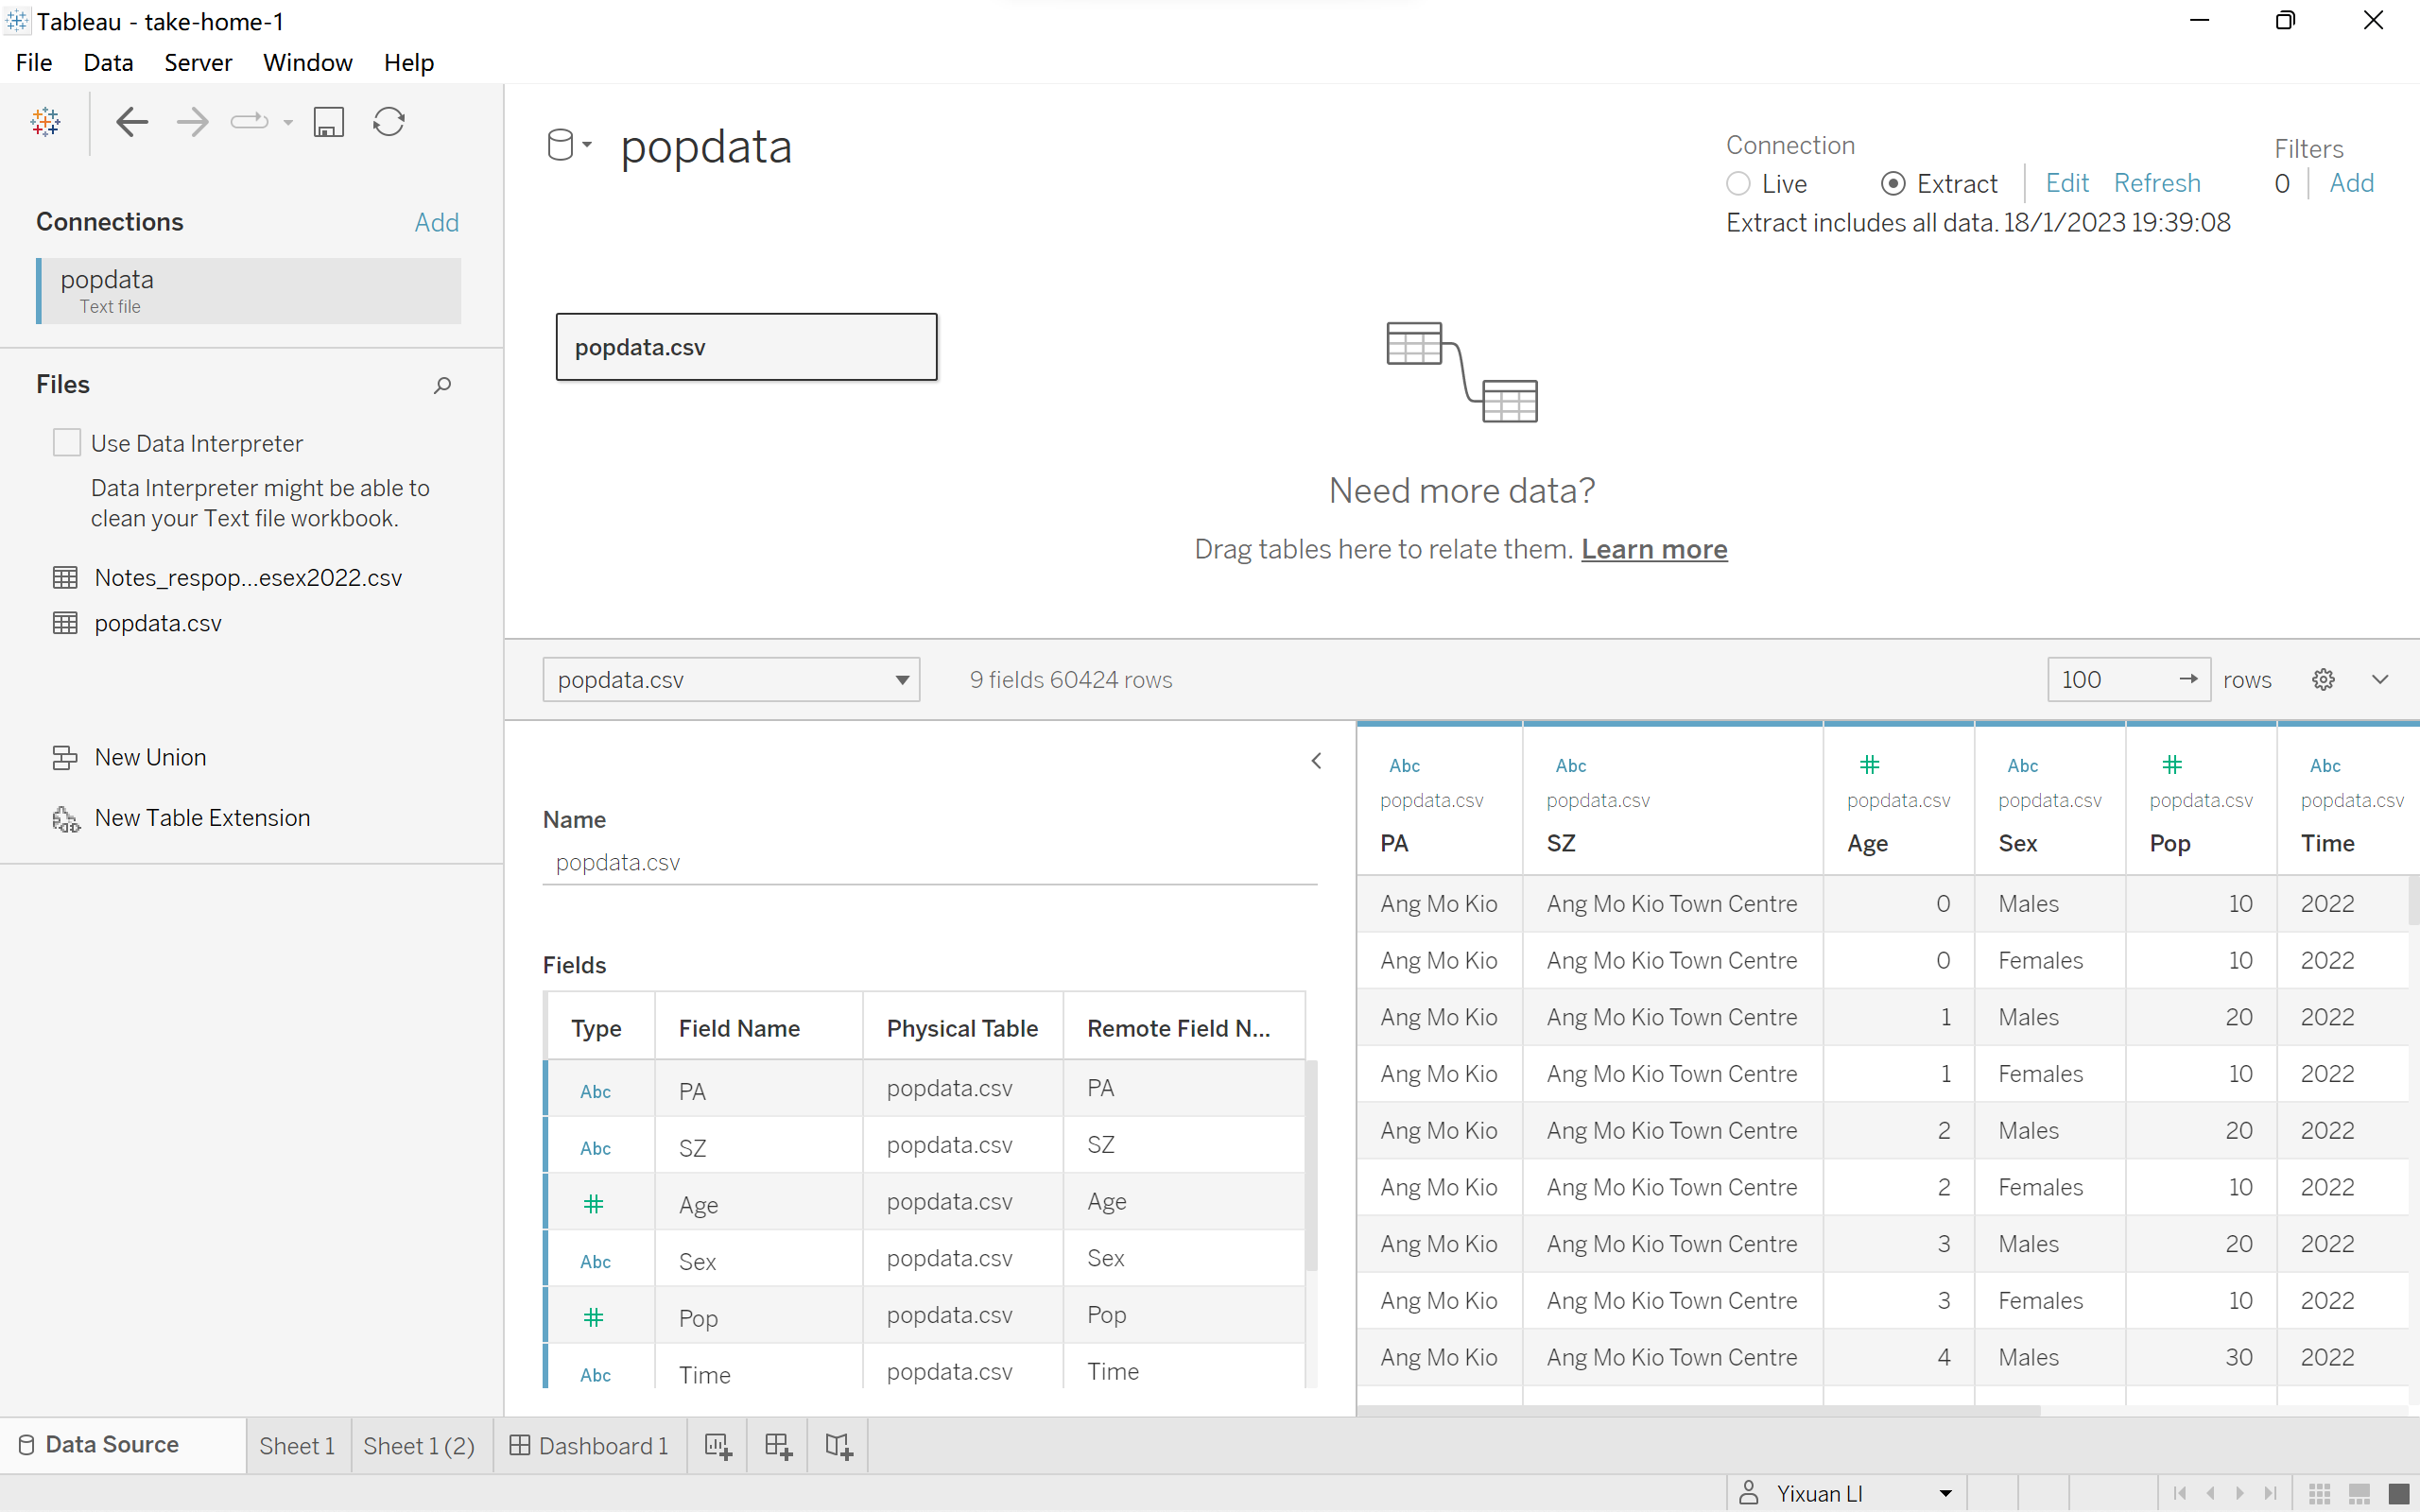
- Load the popdata.csv file into Tableau Desktop.
|
 |
- In order to create the age-sex pyramid, we need the age group,which is the discrete value, instead of continuous value.So, from the ‘data source’ panel, right click on the ‘PA’ and click on ‘create group’. The criteria to make groups is referred to website PopulationPyramid.Net
|
 |
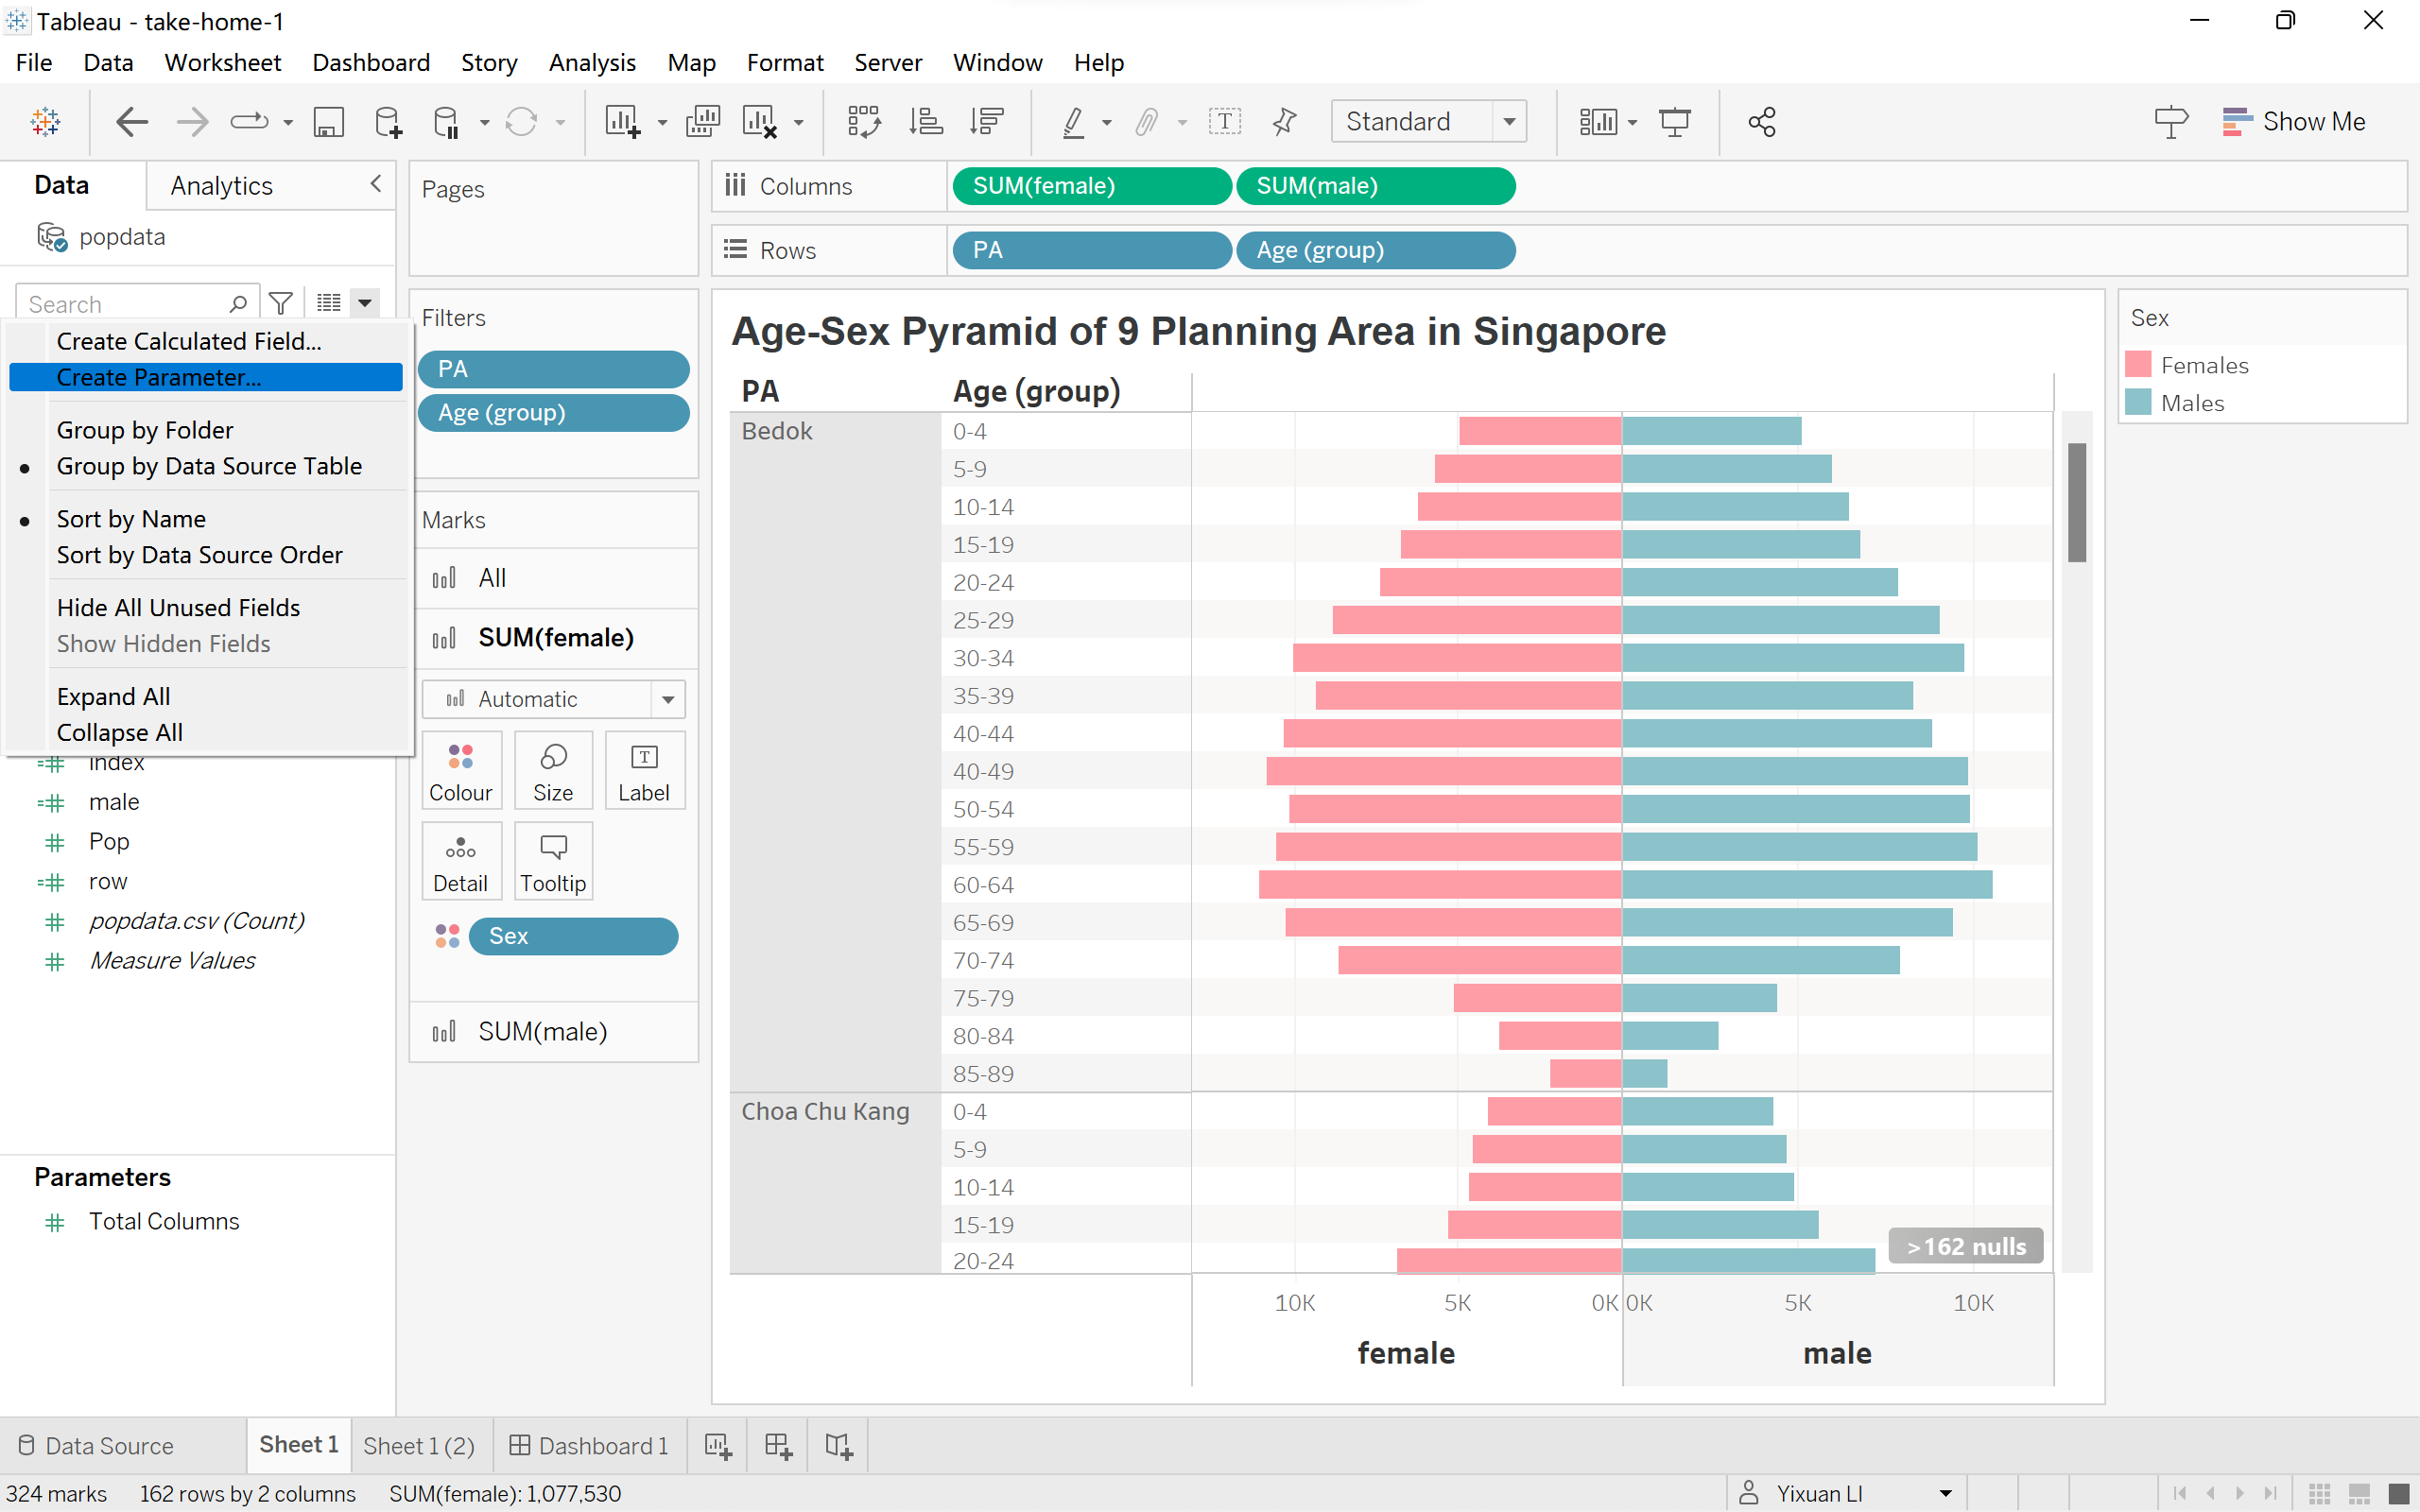
- From ‘Data’ panel, click on the little downside triangle, and click on ‘create parameter’.
|
 |
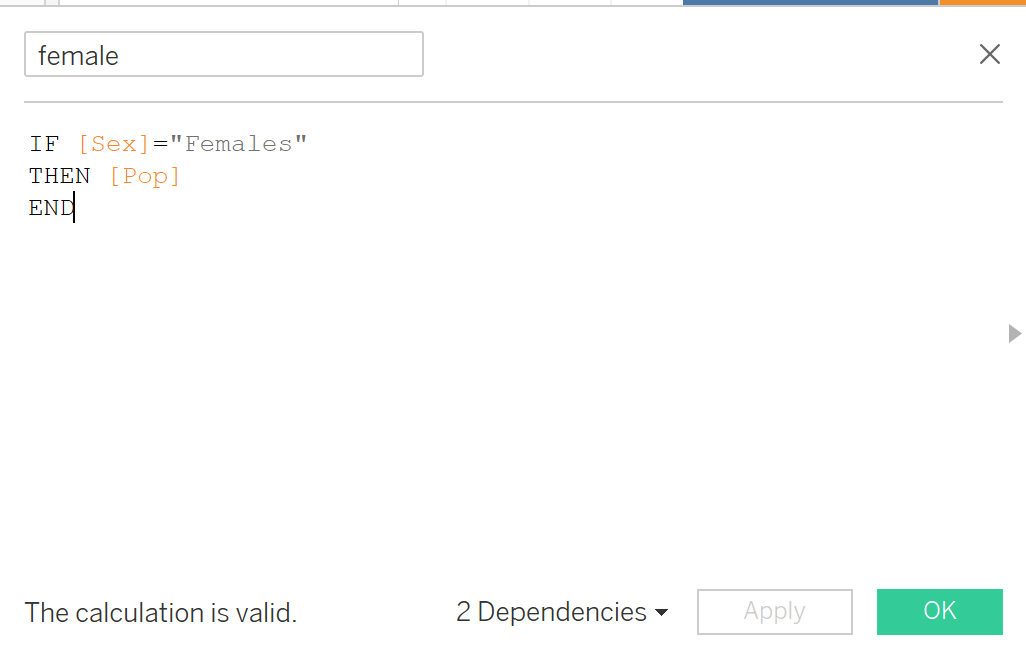
- Create a new parameter called ‘female’, which is the total population of female.
|
 |
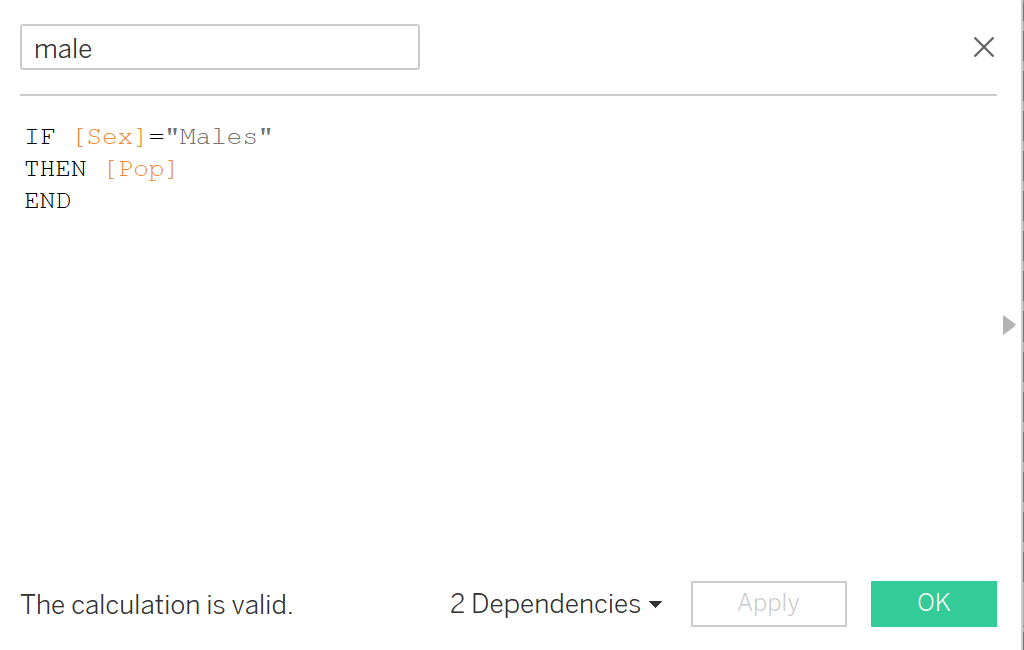
- Create a new parameter called ‘male’,which is the total population of male.
|
 |
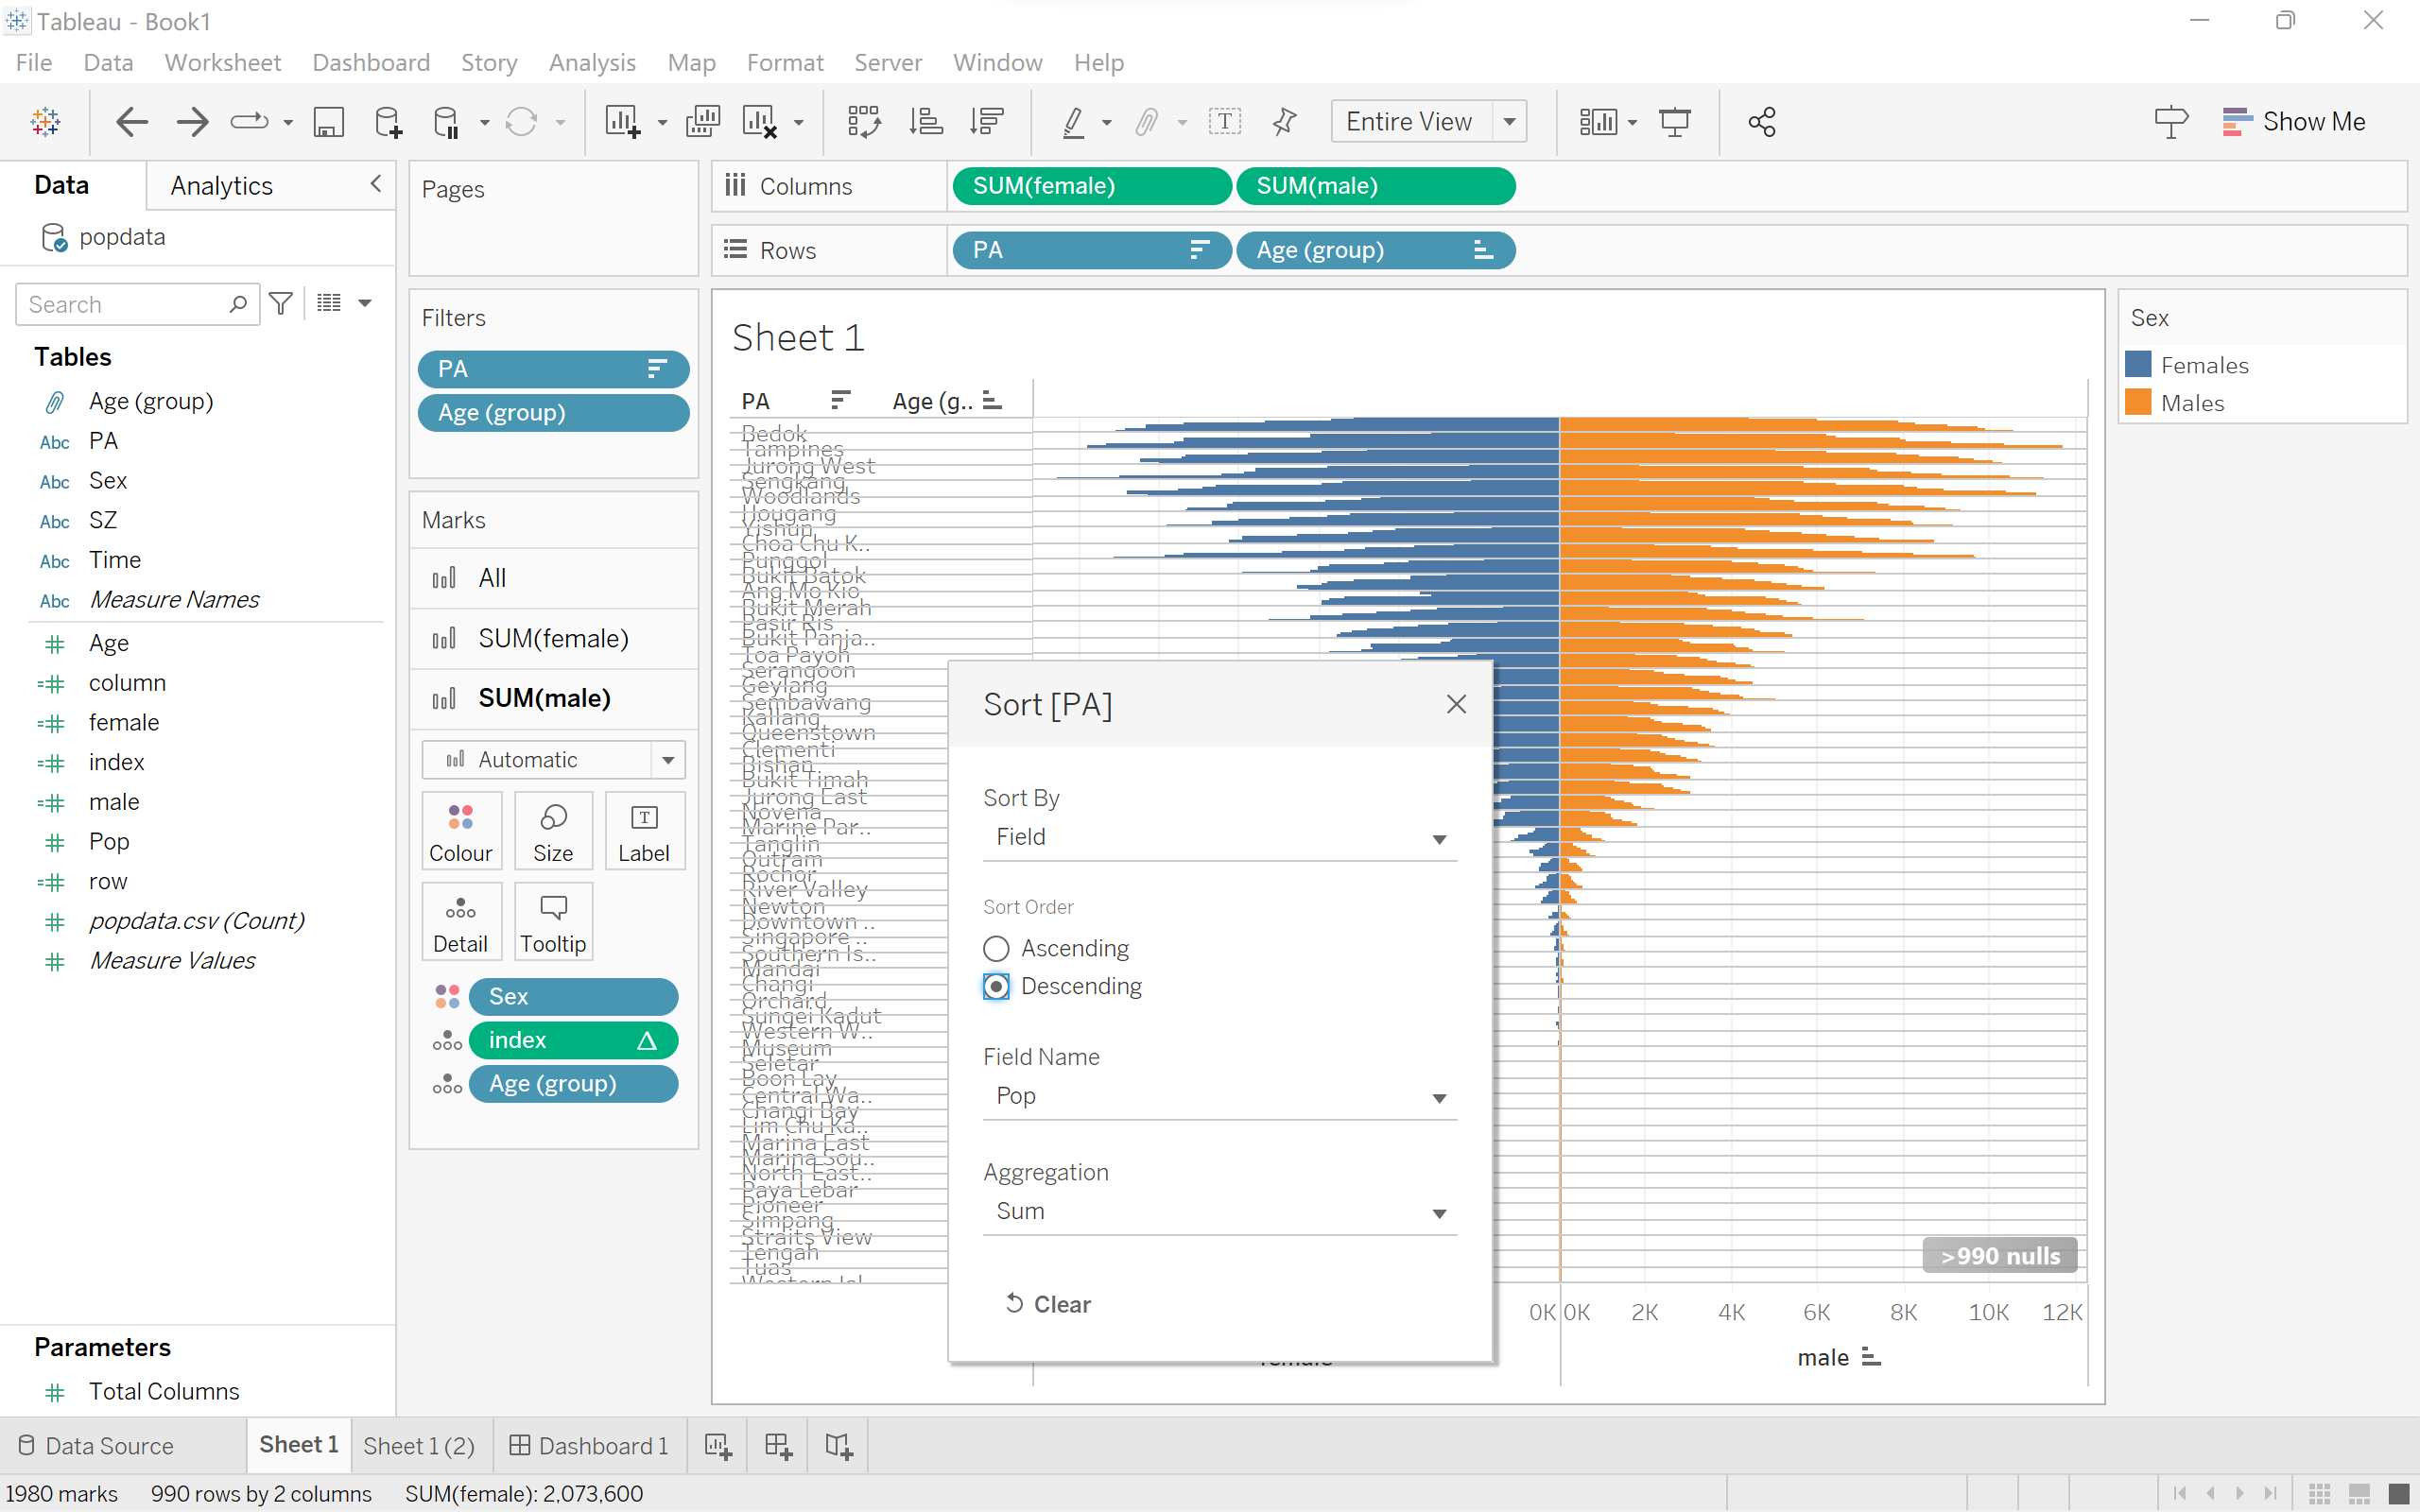
- Drag ‘female’and ’male’ to Columns, ‘PA’ and ‘Age (group)’ to Rows, drag ‘Sex’to colour.Then right click on the title ’PA’ and click on ‘sort’, choose sort by ‘Field’, in descending order and field name is ‘pop’ which is the total population.
|
 |
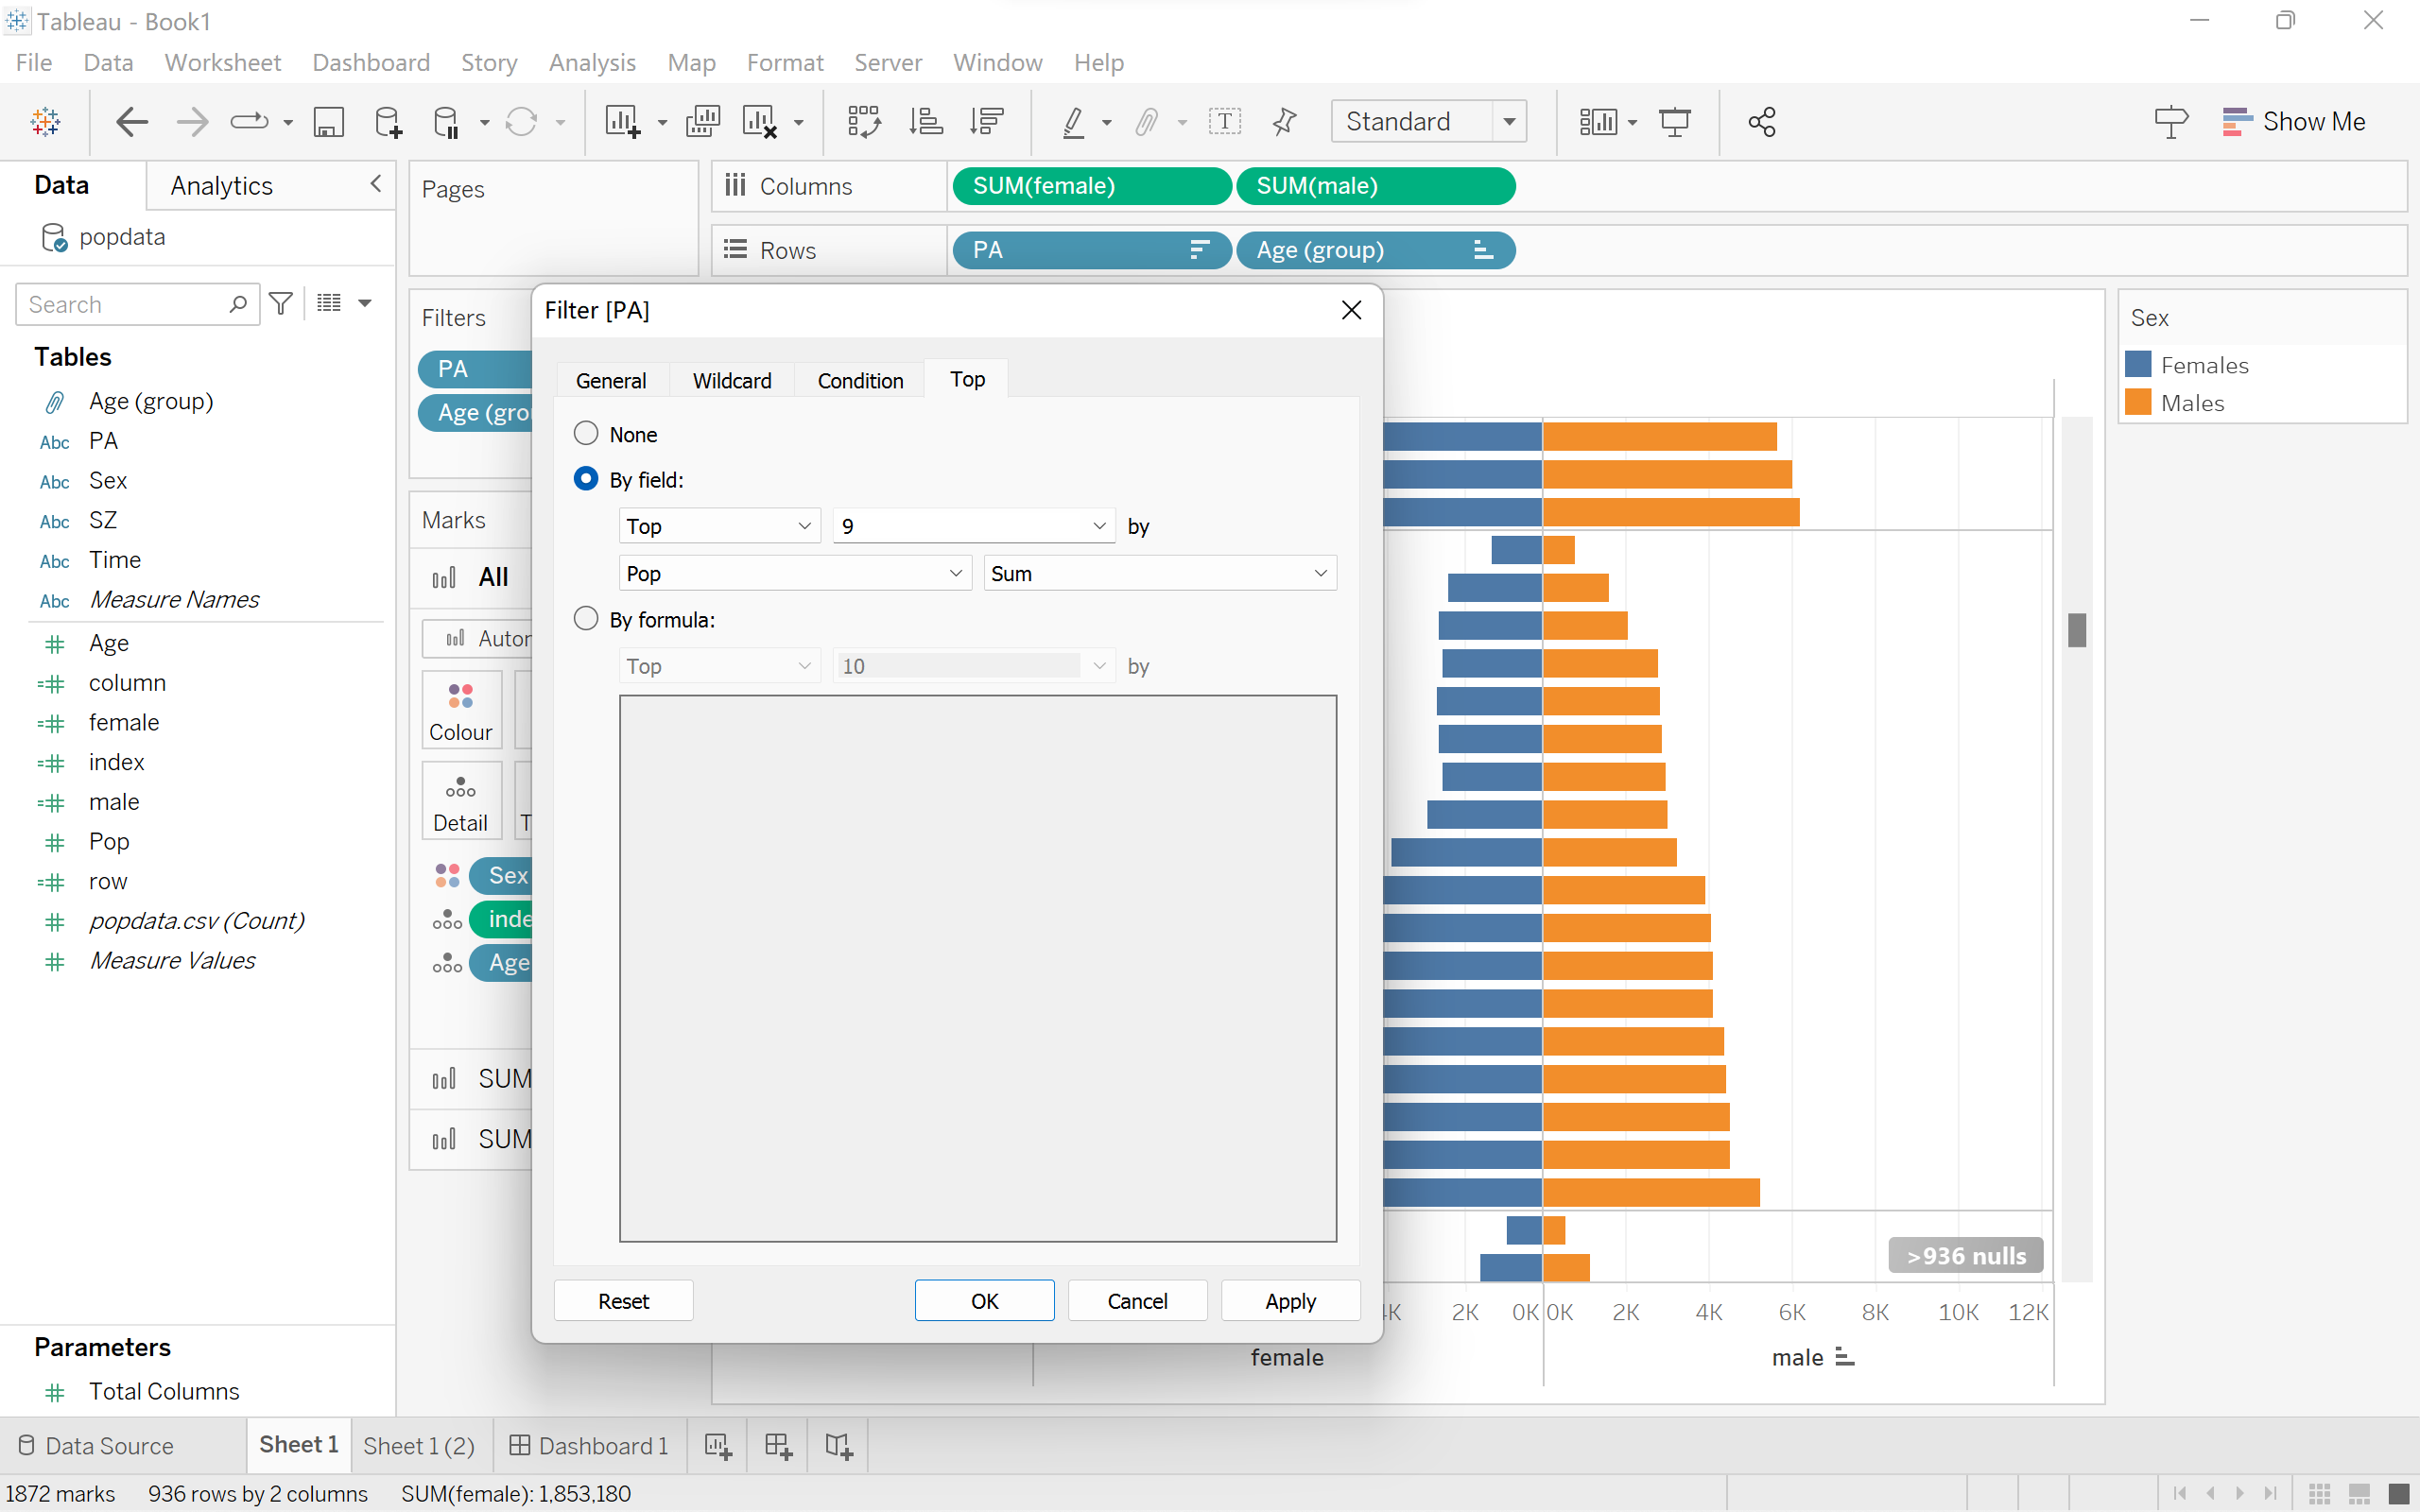
- Then, right click on ‘PA’, click ‘Filter’. Choose the top 9 area with the highest population.
|
 |
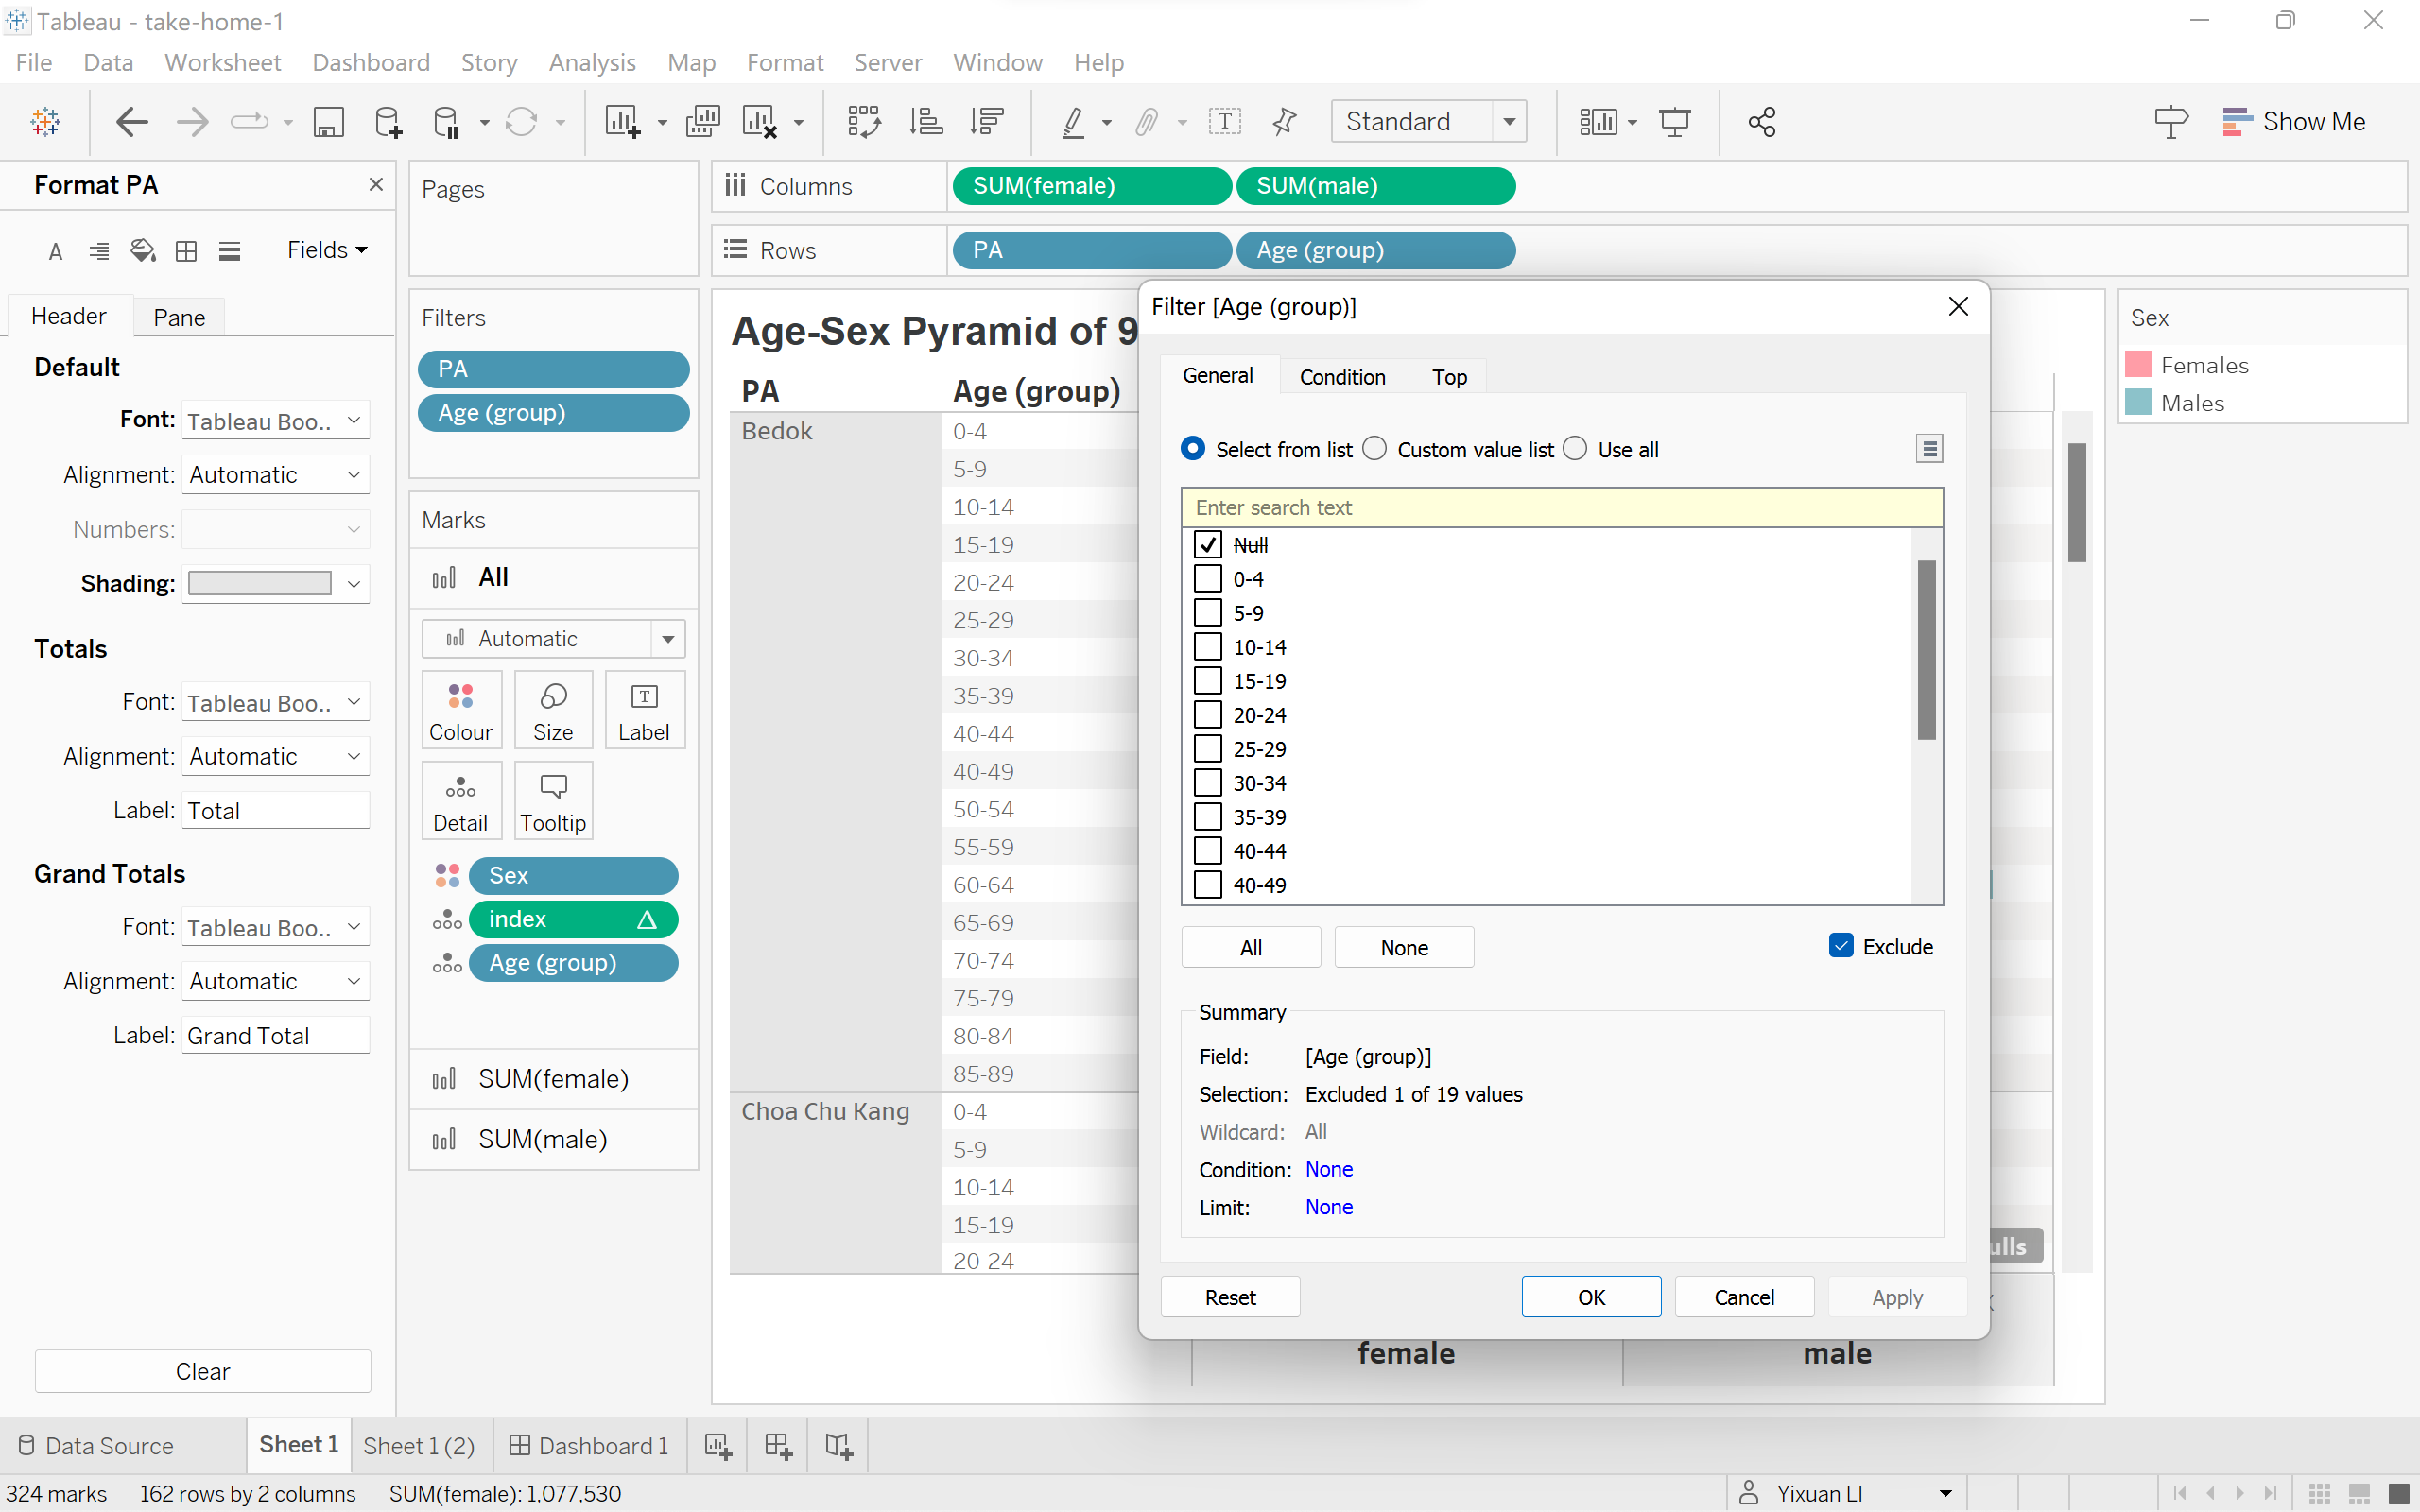
- Right click on ‘Age (group)’, then click ‘Filter’. Check ‘Null’ and check ‘Exclude’.
|
 |
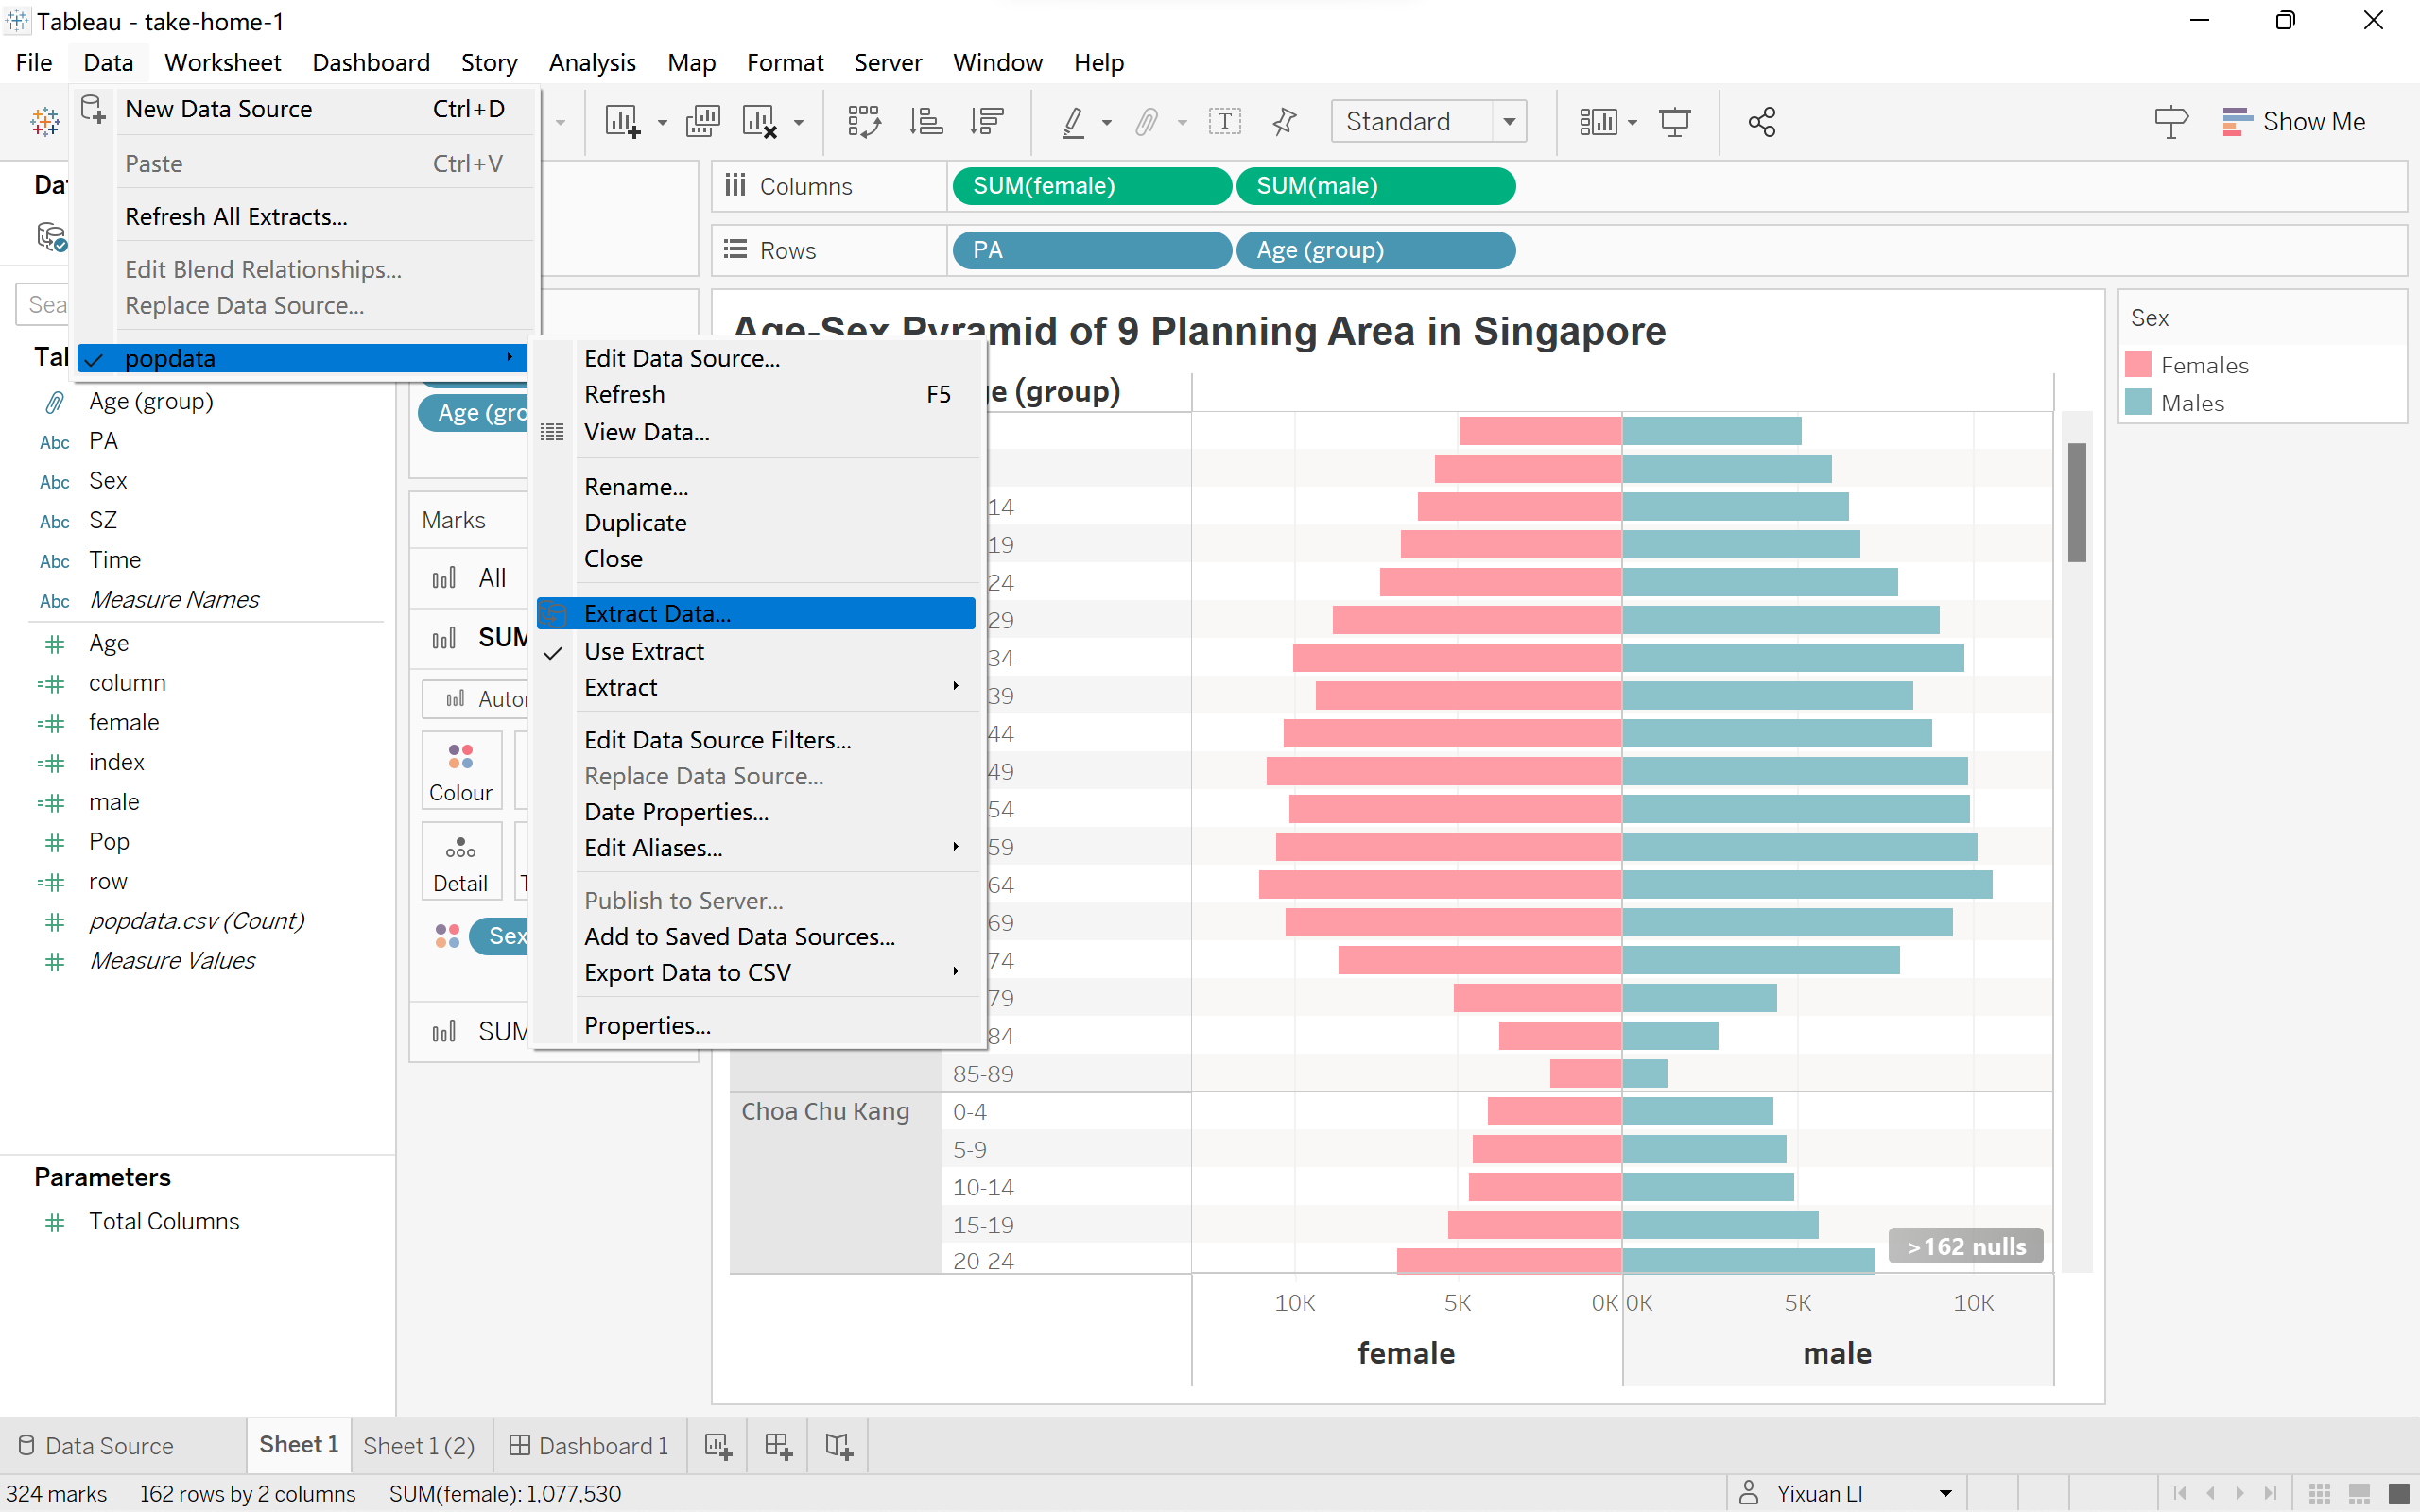
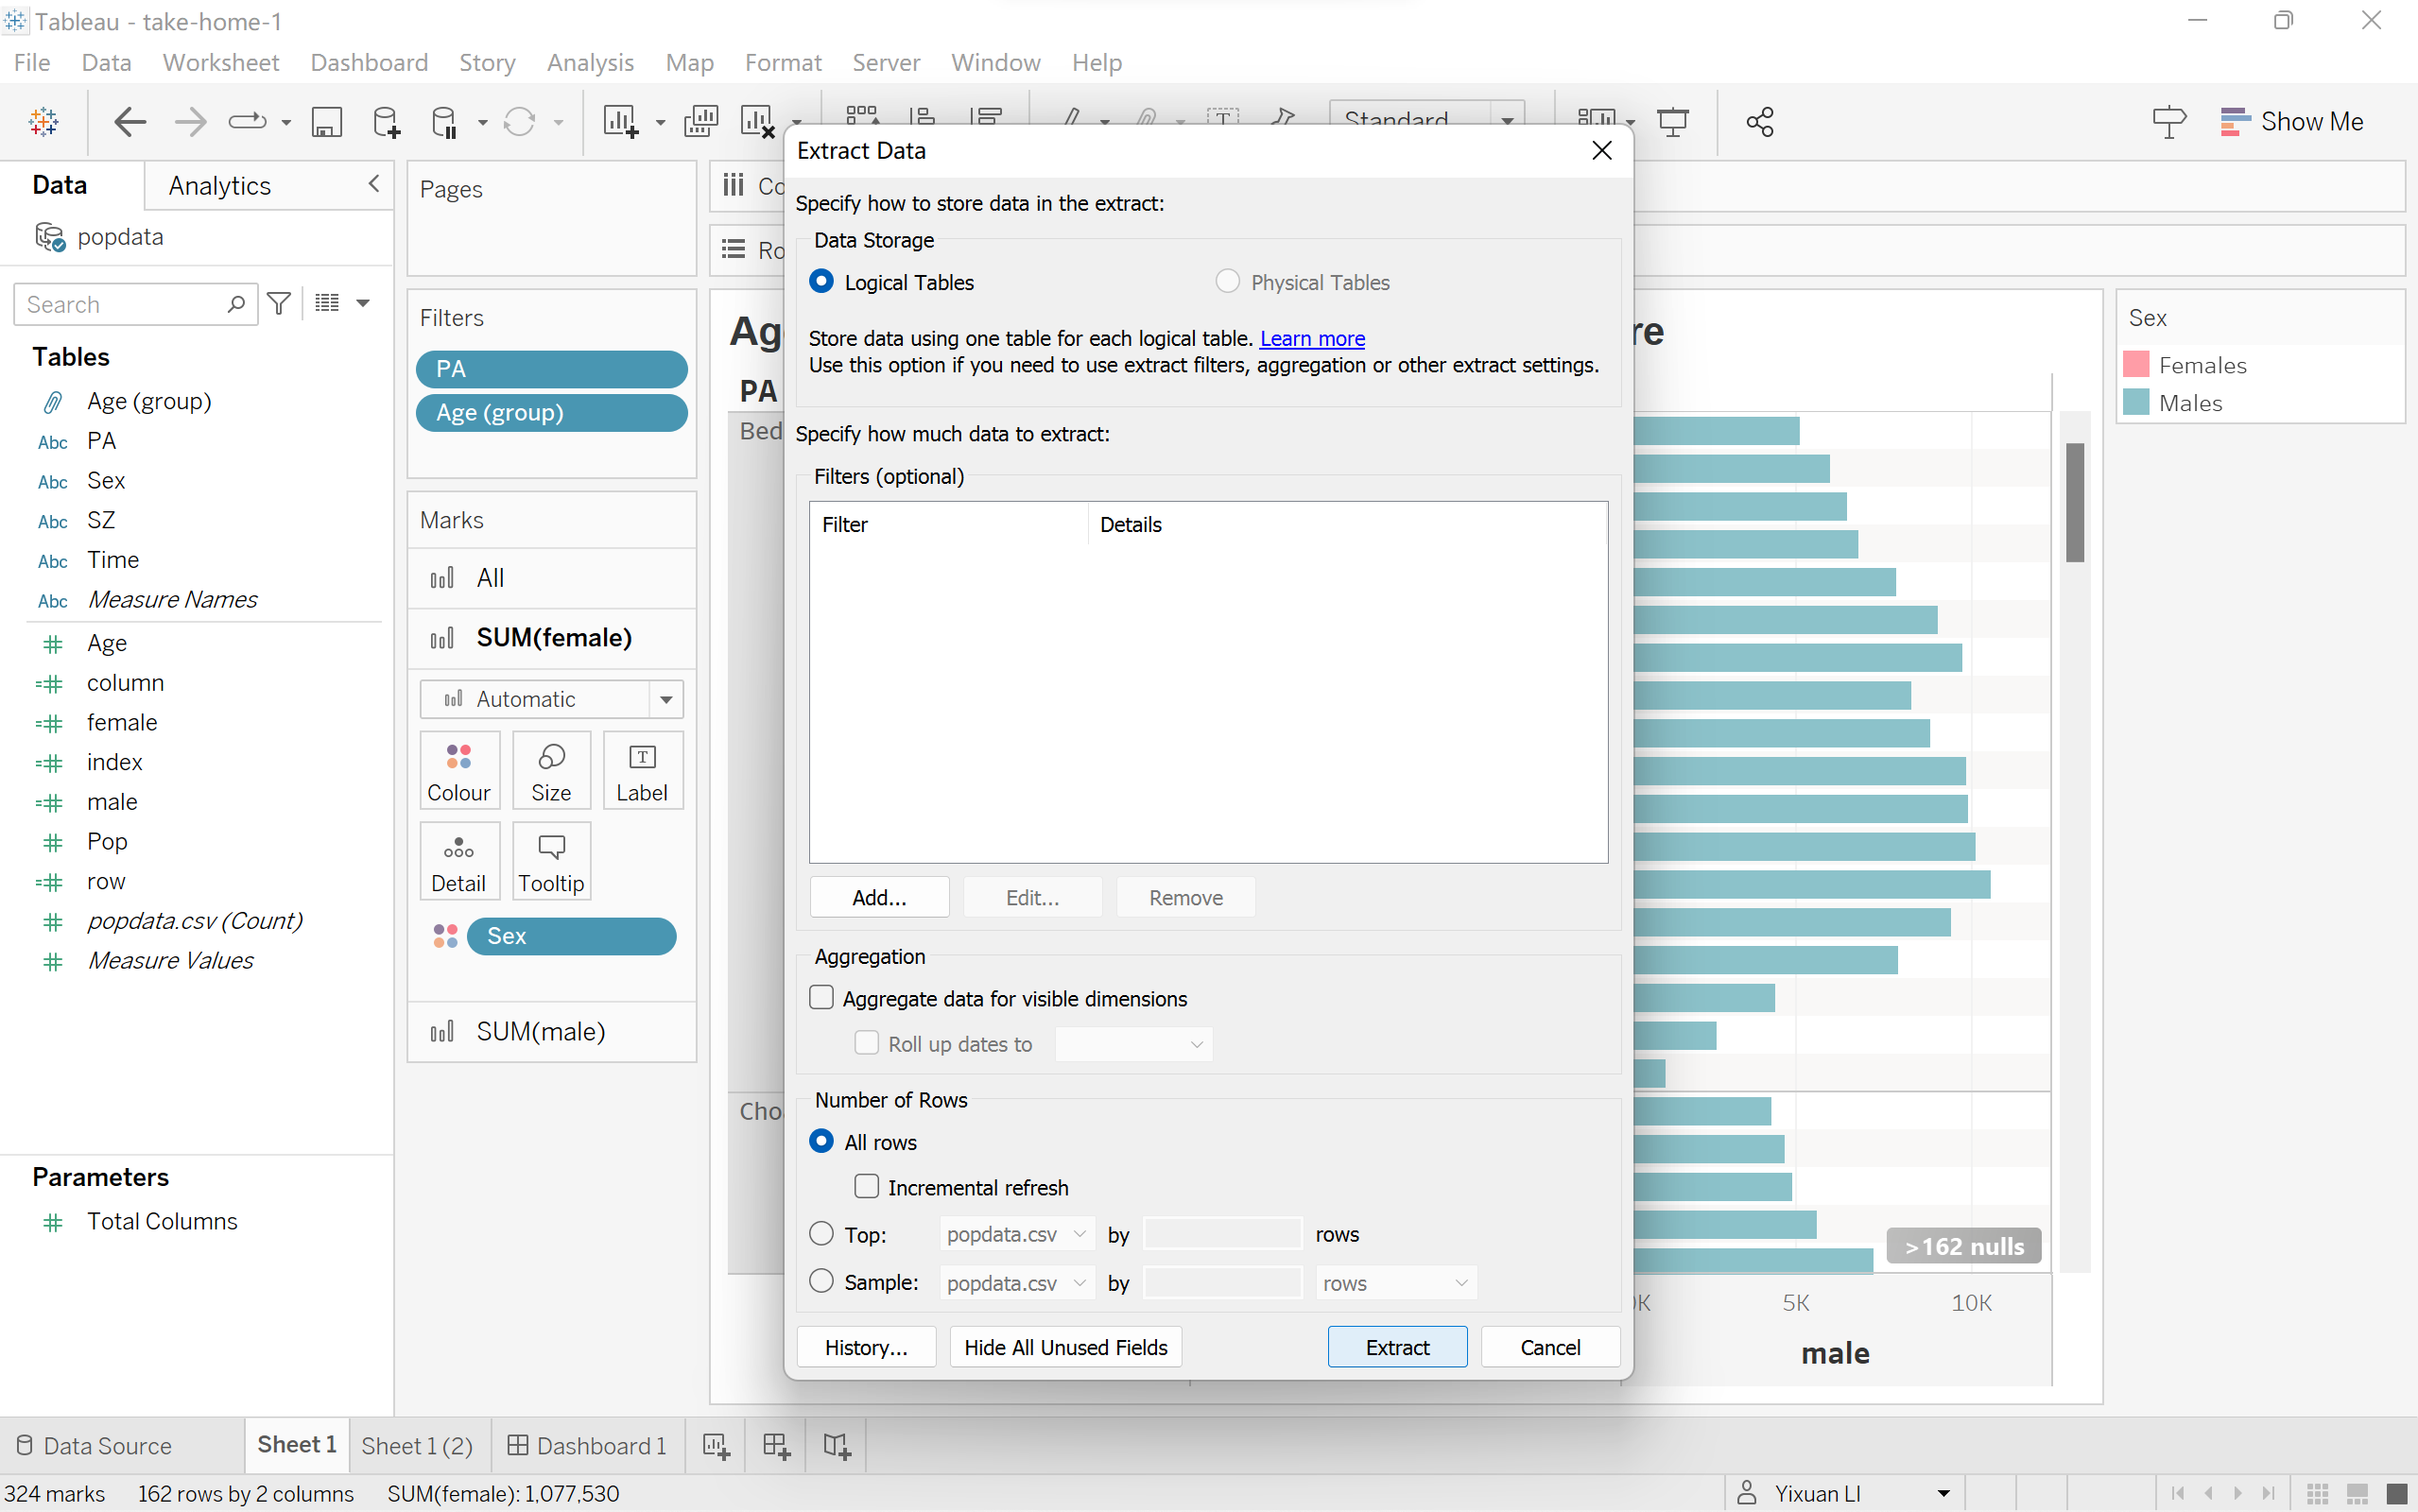
- Click on ‘Data’ at the top of the window, then choose ‘Extract Data’.
|
 |
- Click on ‘Extract’
|
 |
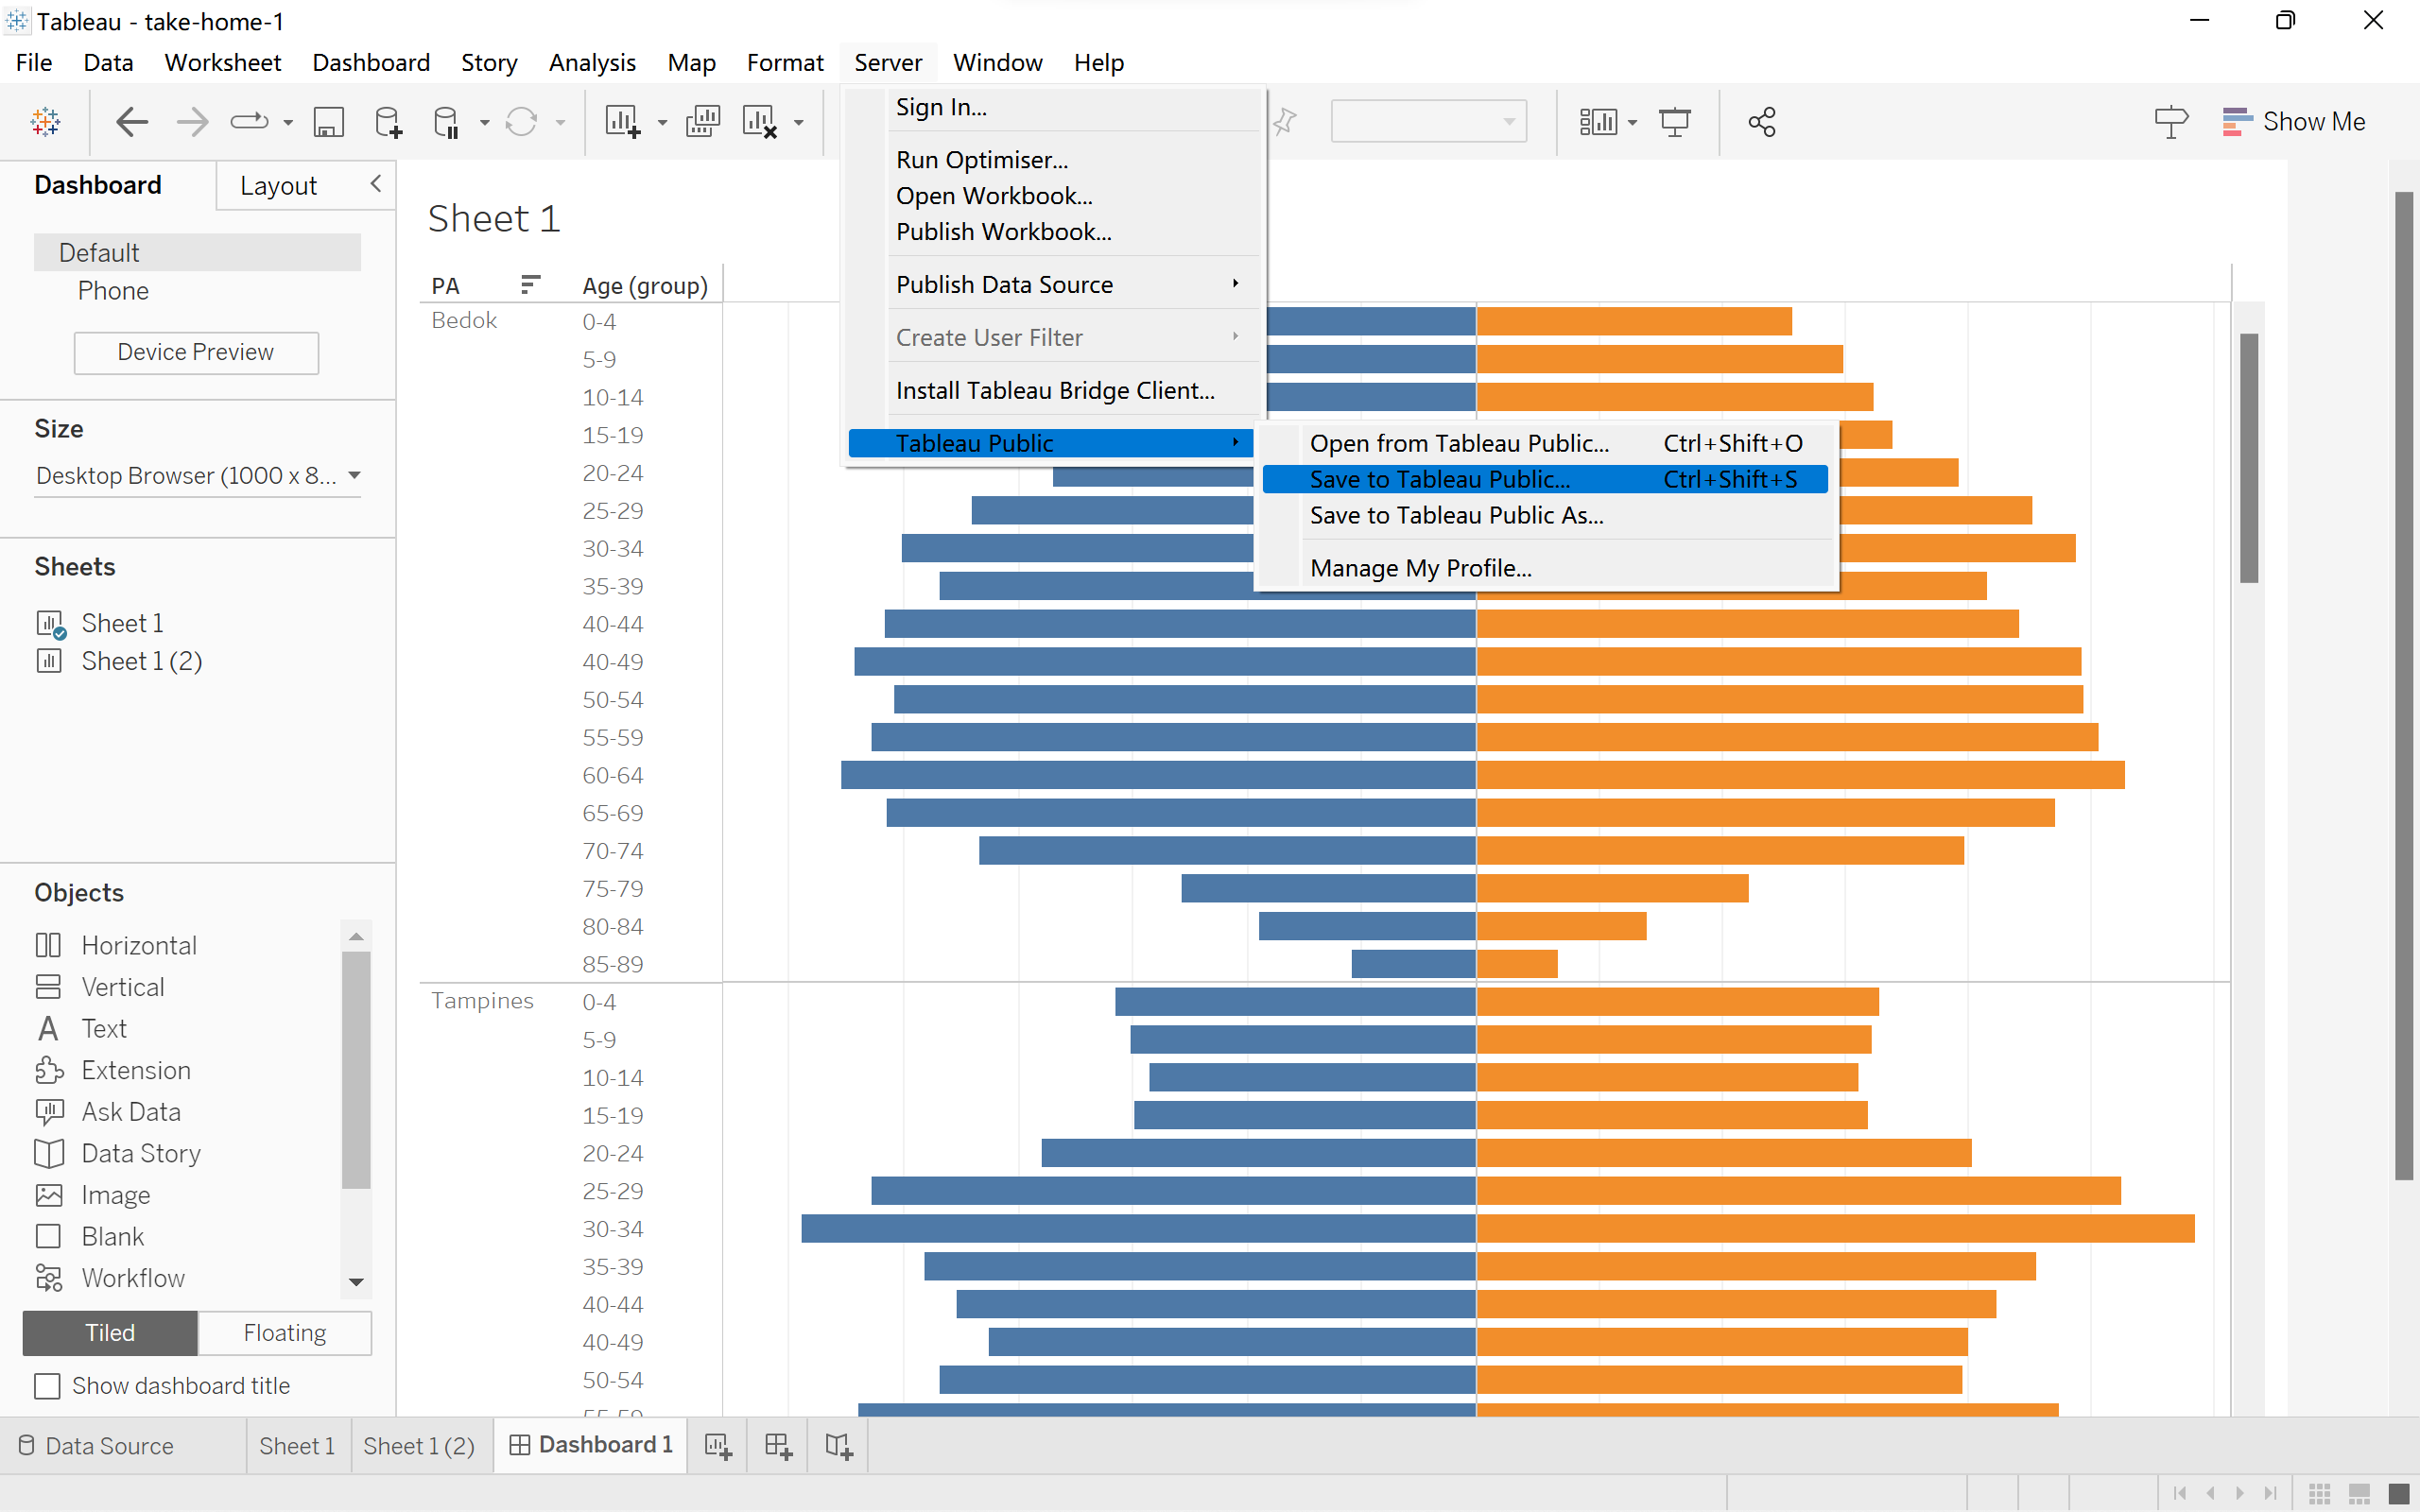
- Click on ‘Server’ at the top, choose ‘Tableau Public’,then ‘Save to Tableau Public’.
|
 |
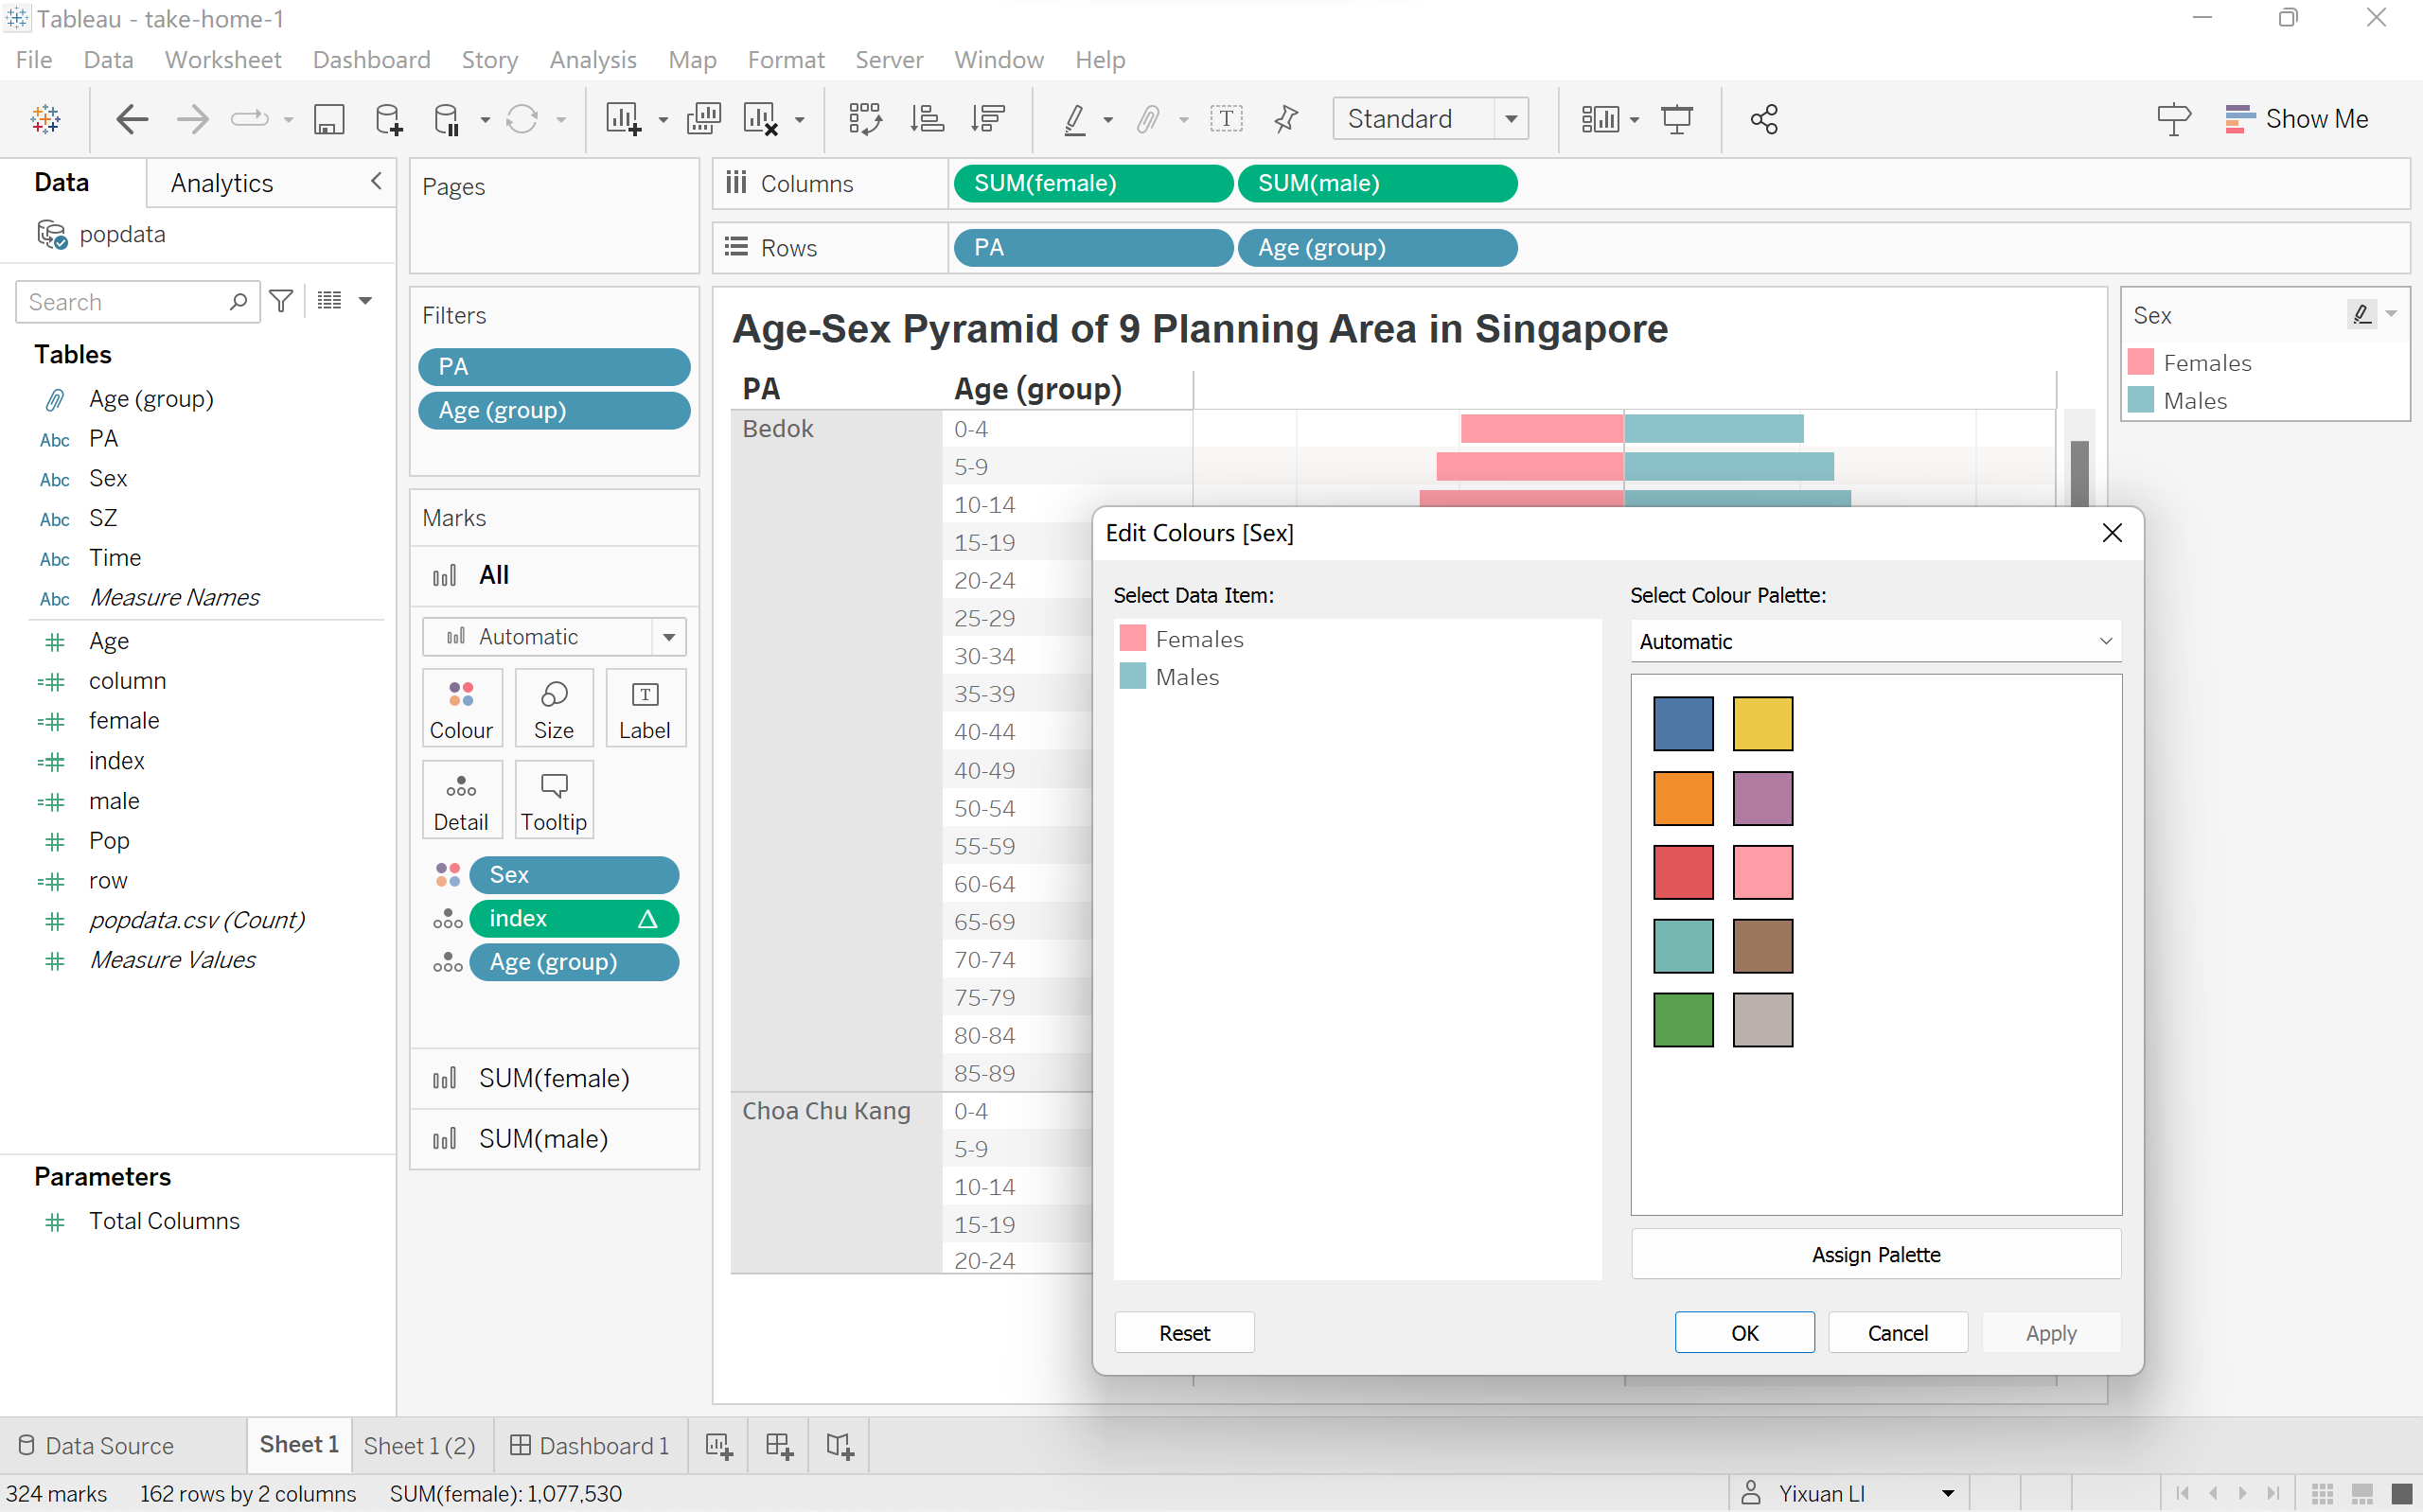
- If not satisfied, click on ‘Color’ under Marks card, click ‘Edit Colors’, then pick more pretty ones.
|
 |
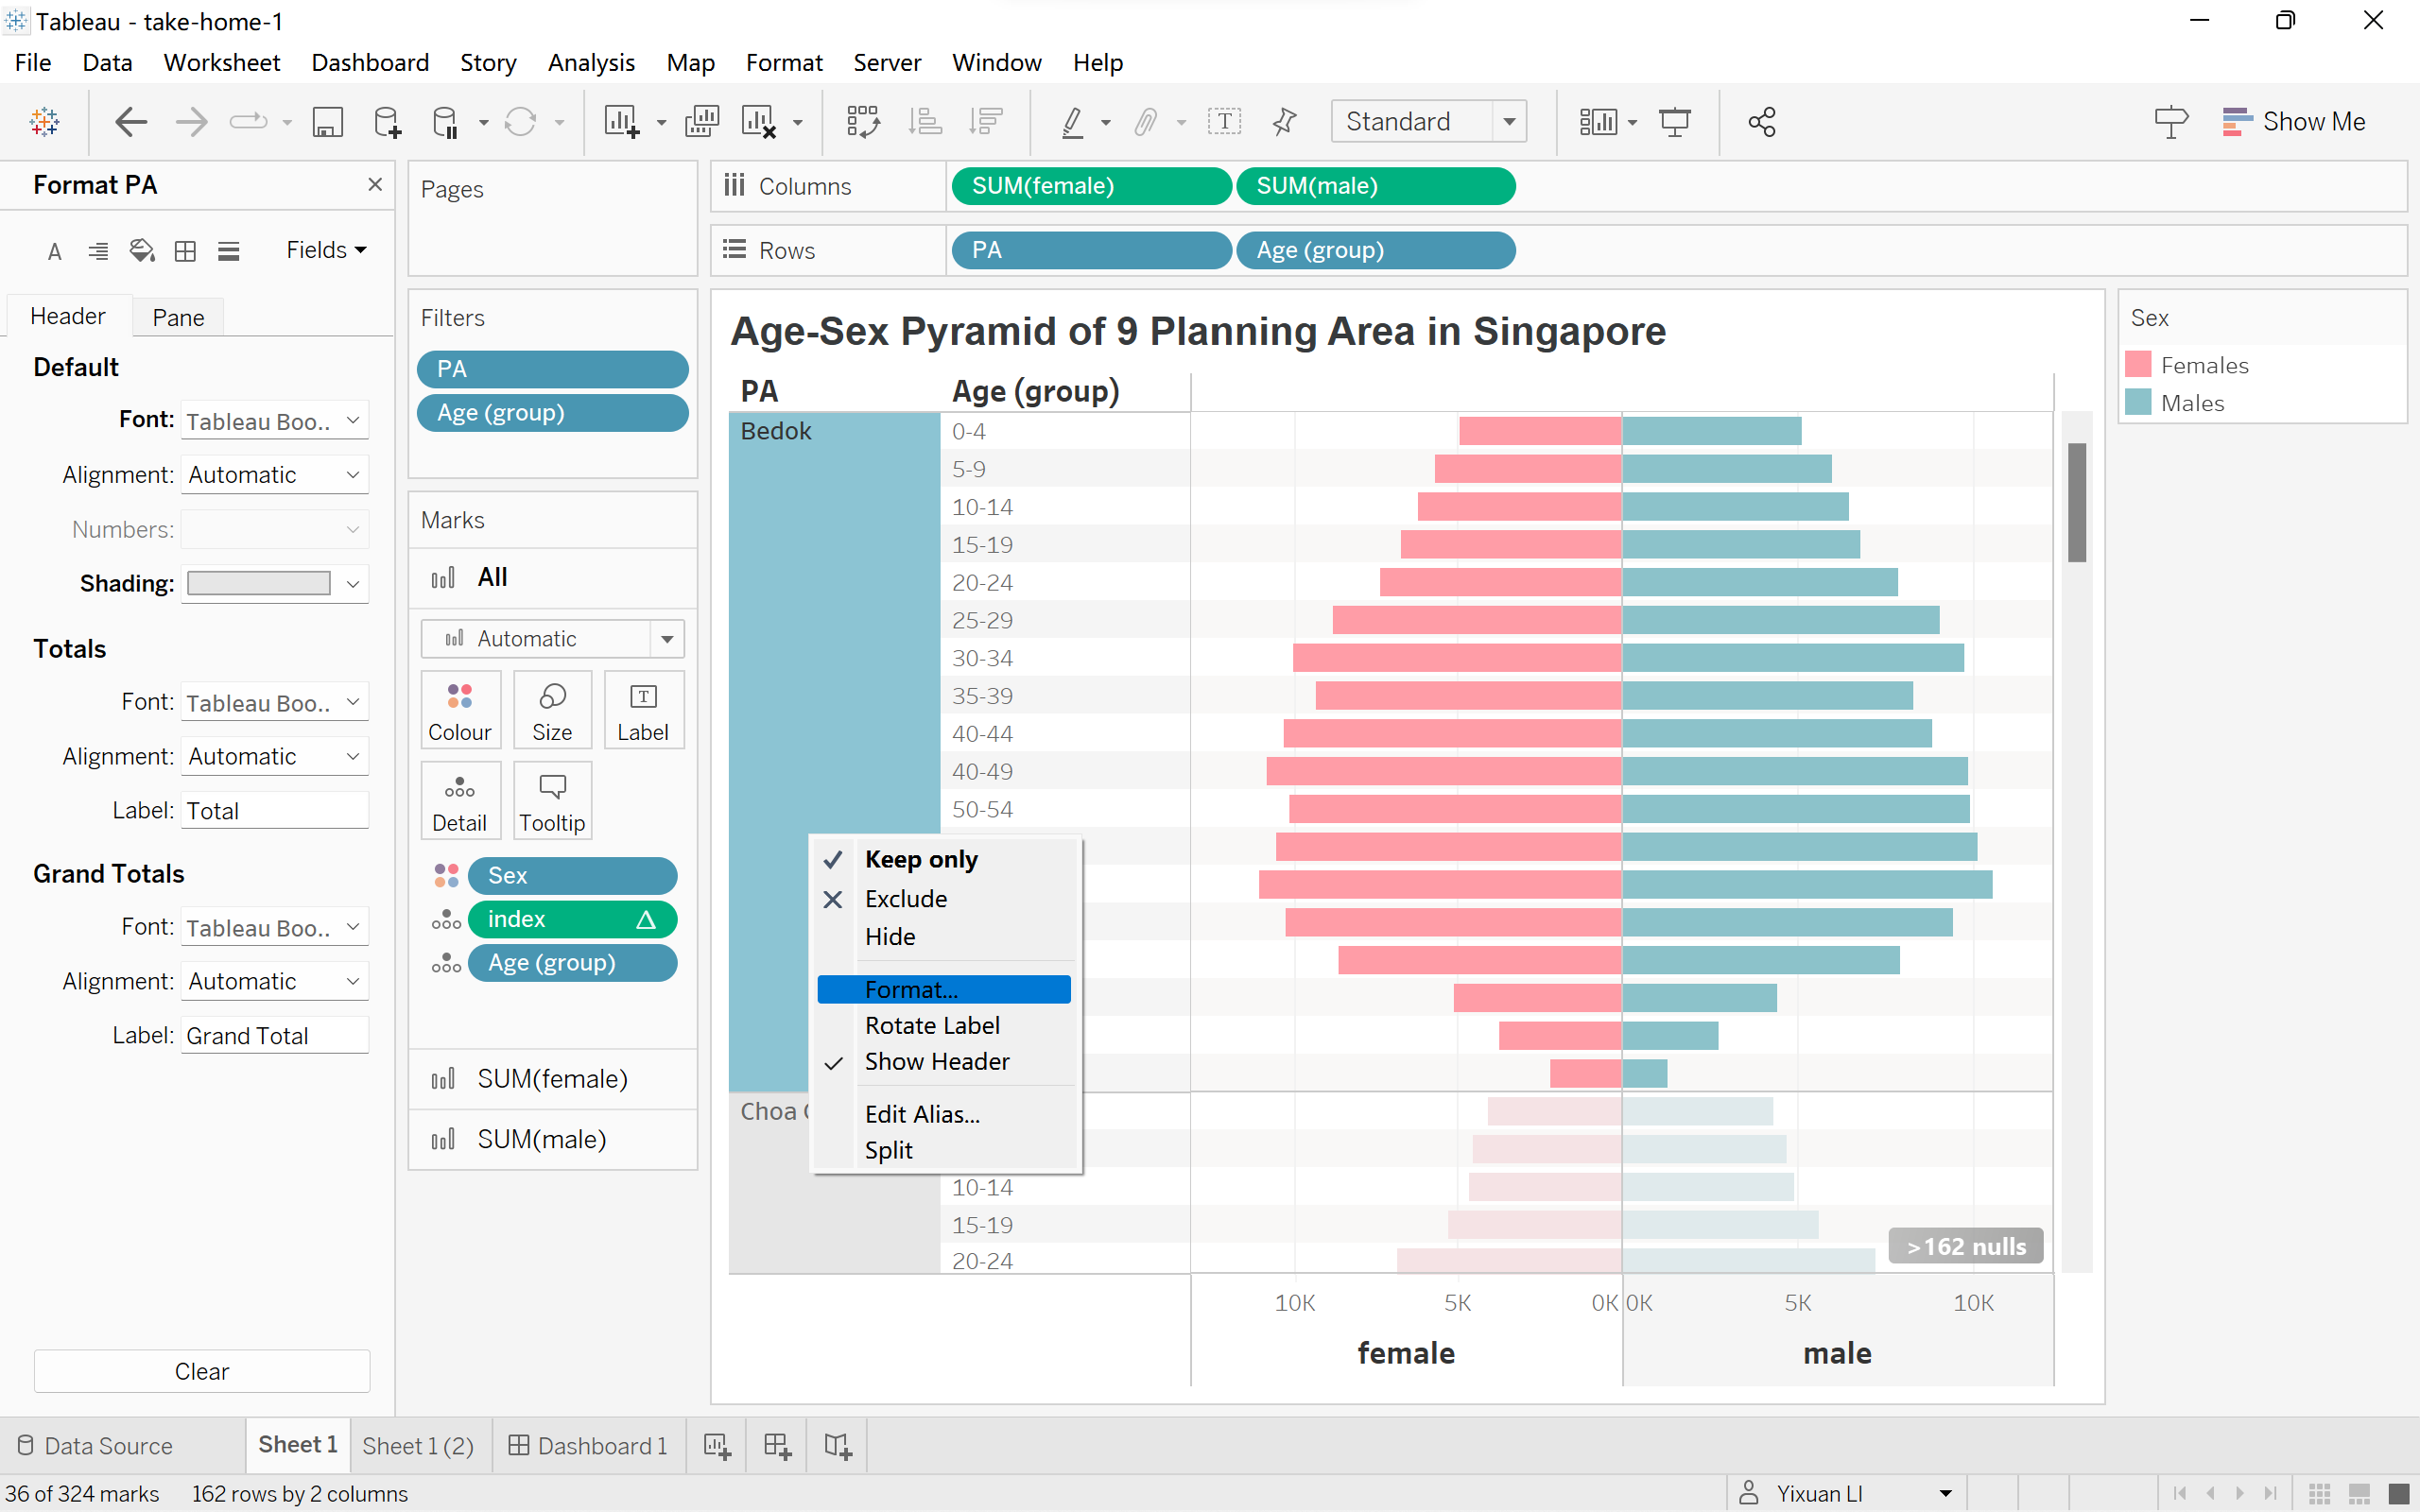
- Click on white space of the ‘PA’ column, click on ‘Format’, and give a shading to this column.
- Public again.
|
 |